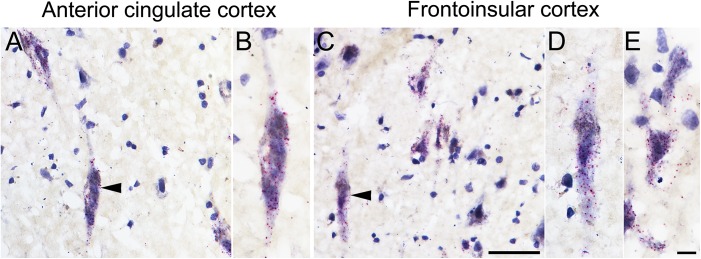
Figure 5.
ADRA1A mRNA expression in ACC and FI confirmed by ISH. Red punctate ADRA1A ISH in VENs, fork cells, and some neighboring Layer 5 neurons with a pyramidal morphology (A, C). Higher magnification views of ADRA1A-expressing VENs in ACC (B) and FI (D) and a fork cell in FI (E). Purple gallocyanin counterstain. Arrowheads indicate VENs. Scale bars represent 50 μm (A, C) or 10 μm (B, D, E).

