Figure 3.
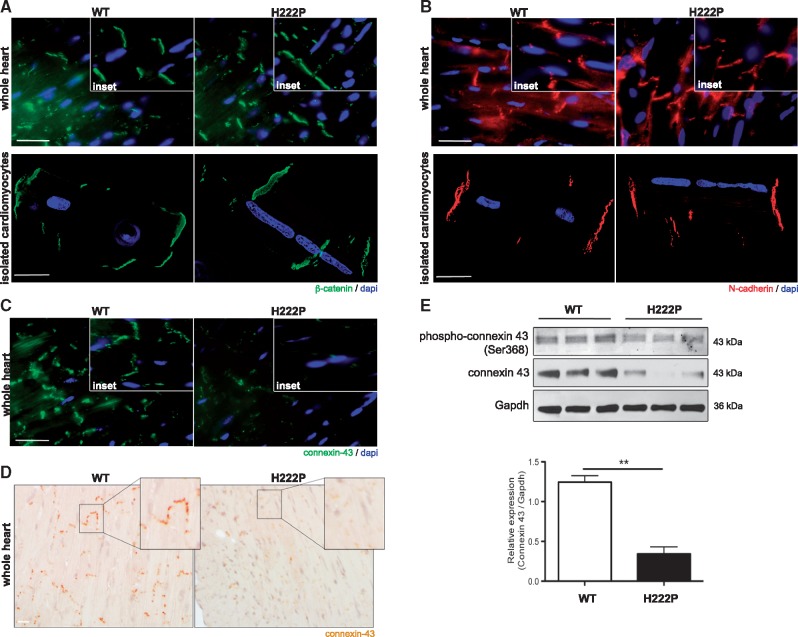
Decreased expression of connexin 43 in hearts of LmnaH222P/H222P mice. (A) Micrographs showing β-catenin labelling (green) in heart and isolated cardiomyocytes from male LmnaH222P/H222P (H222P) and wild type (WT) mice. Nuclei are counter-stained blue with 4′,6-diamidino-2-phenylindole (dapi). Scale bar, 25 μm. Insets are a representative area. (B) Micrographs showing N-cadherin labelling (red) in heart and isolated cardiomyocytes from H222P and WT mice. Nuclei are counter-stained with dapi. Scale bar, 25 μm. Insets are a representative area. (C) Micrographs showing connexin 43 labelling (green) in heart from male H222P mice and WT mice. Nuclei are counter-stained with dapi. Scale bar, 25 μm. Insets are a representative area. (D) Immunohistochemical labelling for connexin 43 in heart from H222P and WT mice. Scale bar, 25 μm. Insets are a representative area. (E) Representative immunoblot showing phospho-connexin 43 (ser368) and total connexin 43 expression in hearts from 6 month-old male H222P and WT mice. Migrations of molecular mass standards in kilodaltons (kDa) are indicated at the right of the blots. The bar graph shows connexin 43 relative expression compared to Gapdh (means ± standard errors of means) in hearts from WT (n = 3) and H222P (n = 3) mice. **P < 0.005.

