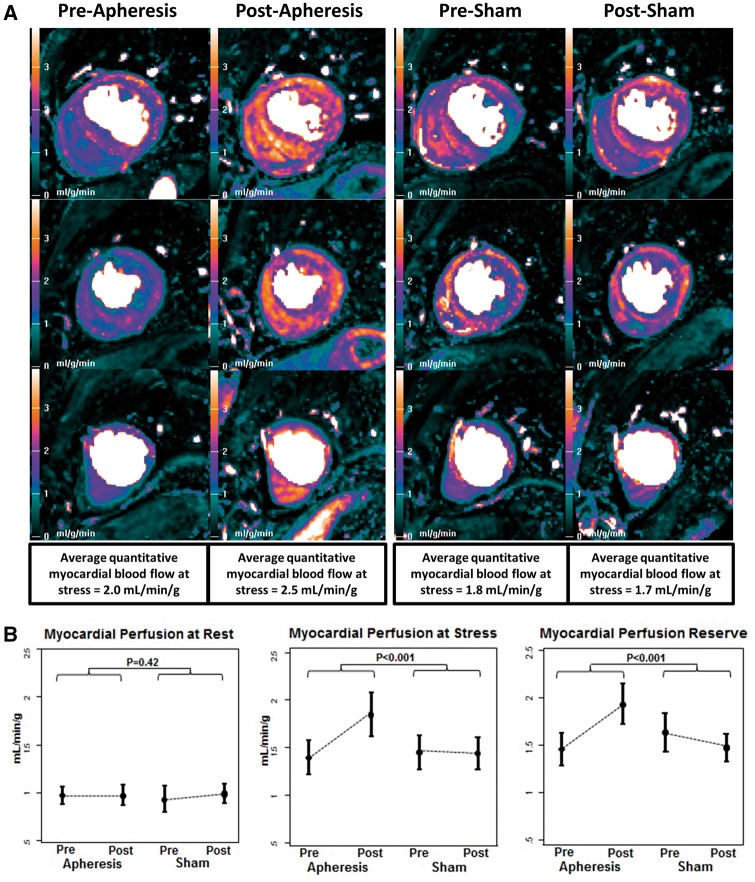
Figure 2.
Quantitative CMR perfusion pixel maps pre and post apheresis and pre and post sham (A) and group data from myocardial perfusion at rest (left), perfusion with stress (middle) and the myocardial perfusion reserve (right) (B). (A) Quantitative CMR perfusion pixel maps pre- and post-apheresis and pre- and post-sham. The colour scale shows perfusion from 0–4 mL/g/min as low (black-green), medium (mauve-pink) and high (orange-white), therefore brighter colours represent greater perfusion. In this single patient example, there is clear improvement in stress perfusion after apheresis compared with baseline, but no change is seen during sham treatment. (B) Group data are shown from myocardial perfusion at rest (left), perfusion with stress (middle) and the myocardial perfusion reserve (right). There are no changes in rest perfusion with apheresis or sham, but stress perfusion increases significantly with apheresis compared with sham. The myocardial perfusion reserve increases with apheresis because of the improved stress perfusion.

