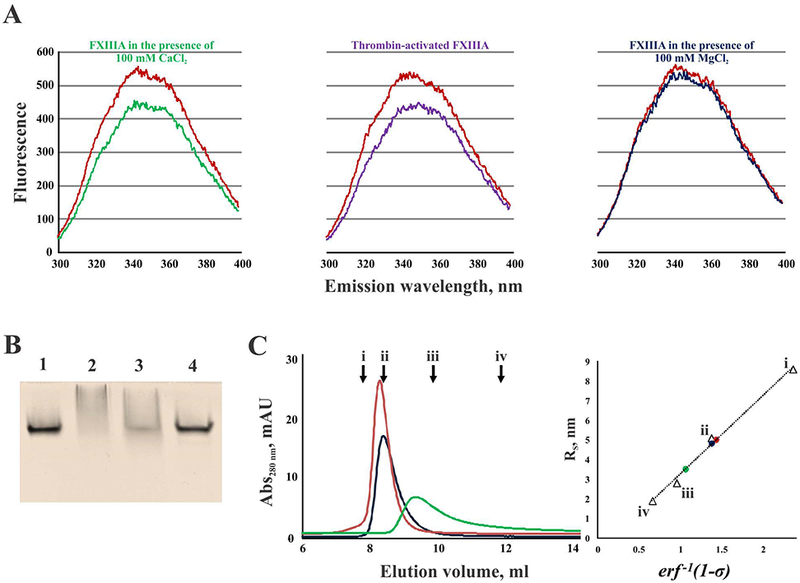
Fig. 2. FXIIIA undergoes conformational rearrangements upon activation.

(A) fluorescence emission spectra of FXIIIA (500 nM) in the presence of 100 mM CaCl2 (green), 100 mM MgCl2 (dark blue), and thrombin-activated FXIIIA in the presence of 4 mM CaCl2 (purple). Control zymogen FXIIIA is shown in red; (B) nPAGE of FXIIIA: lane 1 – zymogen FXIIIA; lane 2 – FXIIIA activated by thrombin in the presence of 4 mM CaCl2; lane 3 – FXIIIA treated with 100 mM CaCl2; lane 4 – FXIII treated with 100 mM MgCl2; (C) Elution profiles of FXIIIA under different conditions (left): 100 μL of 2 μM FXIIIA was applied to a SEC column and elution profiles were recorded for the zymogen form (red), FXIIIA in the presence of 100 mM CaCl2 (green), and FXIIIA in the presence of 100 mM MgCl2 (dark blue). Arrows indicate peak elution volumes (Ve) of the calibration standards (i – thyroglobulin, 670 kDa, Ve = 7.80 ml; ii – bovine γ-globulin, 158 kDa, Ve = 8.40 ml; iii – chicken ovalbumin, 43 kDa, Ve = 9.87 ml; iv – equine myoglobin, 17 kDa, Ve = 11.89 ml); calculation of Stokes radii (RS) for FXIIIA forms based on their partition coefficients (σ): inverse error function of 1-σ (erf −1 (1-σ)) was plotted versus Stokes radii (RS) for the calibration standards (triangles, i – thyroglobulin, RS = 8.6 nm; ii – bovine γ-globulin, RS = 5.1 nm; iii – chicken ovalbumin, RS = 2.8 nm; iv – equine myoglobin, RS = 1.9 nm). Using the calibration line, the RS-values were calculated for FXIIIA samples (circles): zymogen (red, RS = 5.0 nm), FXIIIA treated with 100 mM MgCl2 (dark blue, RS = 4.8 nm), and FXIIIA in the presence of 100 mM CaCl2 (green, RS = 3.5 nm).
