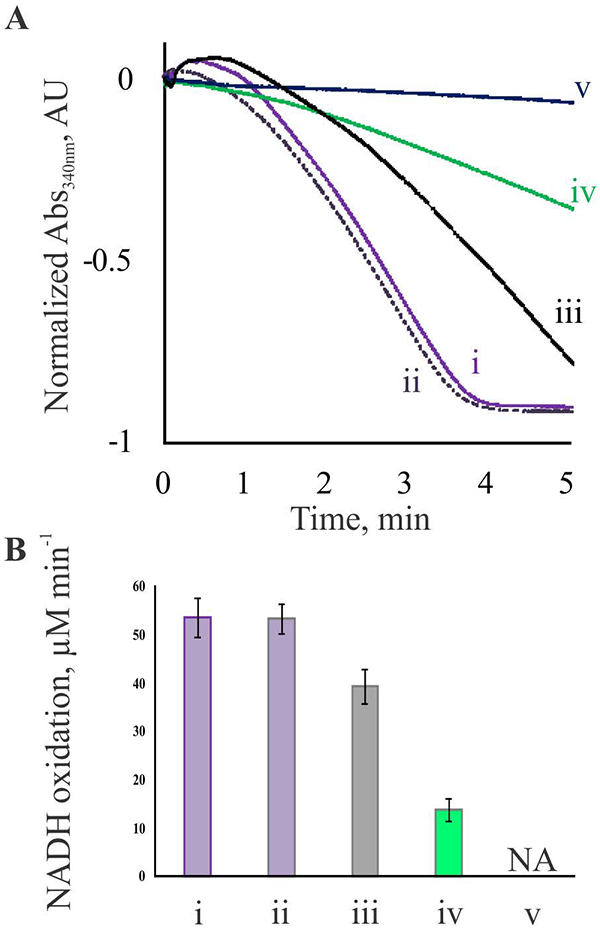
Fig. 7. FXIIIA catalytic activity studies.

Transglutaminase activity of FXIIIA was determined via a coupled spectrophotometric assay, as described under Experimental Procedures. (A) Representative absorbance curves monitoring FXIIIA-mediated ammonia release followed by oxidation of NADH. (i) – FXIIIA fully cleaved by thrombin in the presence of 4 mM CaCl2; (ii) – same as (i), with addition of 5% DMSO; (iii) – FXIIIA sample with ~50% of the A-subunits cleaved by thrombin in the presence of 4 mM CaCl2; (iv) – FXIIIA incubated in the presence of 100 mM CaCl2; (v) – FXIIIA incubated in the presence of 100 mM MgCl2. (B) transglutaminase activity of FXIIIA is presented by the rate of ammonia-dependent NADH oxidation. Measurements were performed in triplicates for each condition outlined in part A. NADH oxidation rate in the presence of 100 mM MgCl2 was essentially the same as that in absence of FXIIIA. Values are presented as mean ± SD (n=3).
