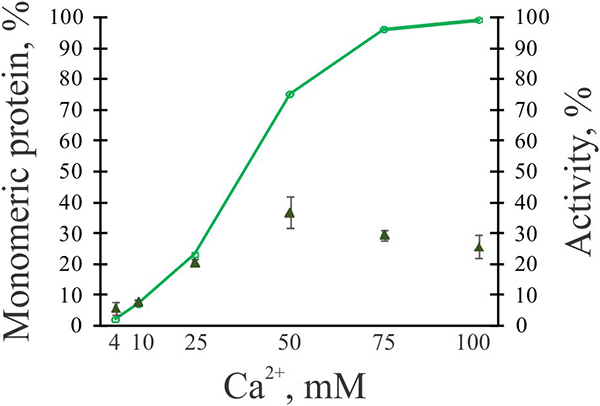
Fig. 8. FXIIIA dissociation and activity as a function of Ca2+ concentration.

2 μM FXIIIA was incubated in the presence of 4–100 mM CaCl2 for 30 min at 37°C. Samples were then subjected to sedimentation velocity AUC, and quantitation of monomeric species was performed for each sample (green line). AUC runs were performed with at least two independently made samples for each condition studied. In parallel, transglutaminase activity of FXIIIA with different CaCl2 concentrations was determined using a coupled spectrophotometric assay (green triangles, values are presented as mean ± SD (n=3). The % activity is compared to thrombin-activated FXIIIA (100%)).
