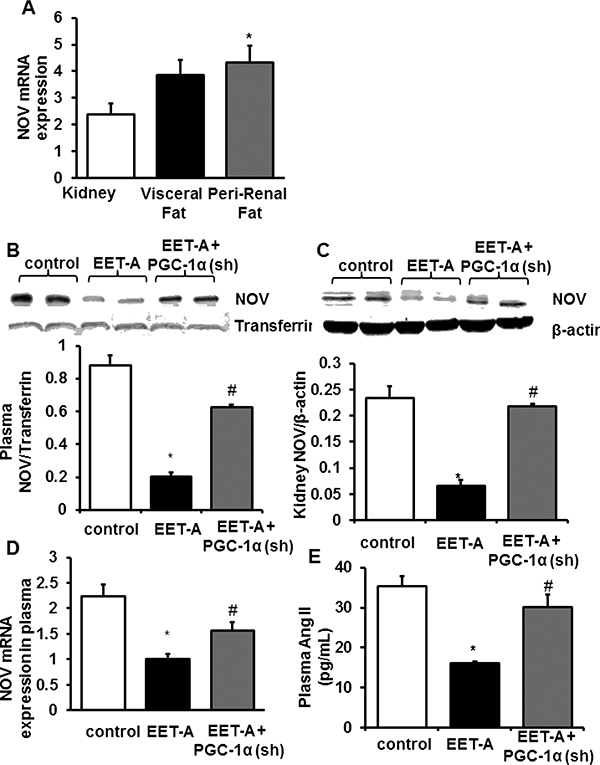
Figure 6.

Tissue expression of NOV and EET agonist effect on plasma and kidney NOV levels and plasma Angiotensin 2. (A) The mRNA expression of NOV in kidney, visceral fat, and peri-renal fat. (B) Representative western blots, densitometry analysis of NOV in plasma of db/db control mice, db/db treated with EET-A mice, and PGC-1α- deficient. (C) Representative western blots, densitometry analysis of NOV in Kidney of db/db control mice, db/db treated with EET-A mice, and PGC-1a-deficient. (D) mRNA expression of NOV in plasma of db/db control mice, db/db treated with EET-A mice, and PGC-1α-deficient. (E) Plasma Angiotensin II. Results are means ± SE, n=6, *p<0.05 vs db/db control, # p<0.05 vs db/db mice treated with EETA /.
