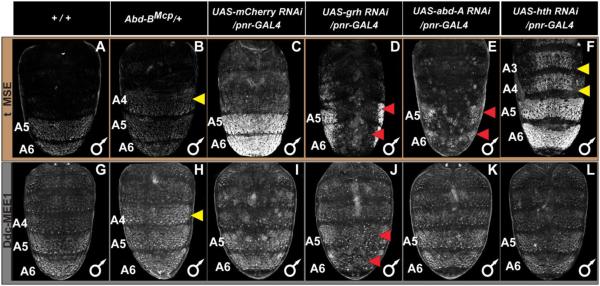
Fig. 9. Genetic interactions between pigmentation network transcription factors and CREs regulating tan and Ddc expression.
(A–F) EGFP reporter expression driven by the t_MSE was imaged at the P14-15(i) stage. (G–L) EGFP reporter expression driven by the Ddc-MEE1 was imaged at the P14-15(i) stage. The relevant genetic background genotypes are listed at the top of each column. All specimens are hemizygous for the EGFP reporter transgene. Compared to the (A and G) wild type genetic background, (B) t_MSE, and (H) Ddc-MEE1 regulatory activity expands into the A4 segment in which Abd-B is ectopically expressed. Compared to a (C) control genetic background, suppression of (D) grh expression resulted in a stark loss of t_MSE activity. In contrast, the suppression of (E) abd-A and (F) hth expression respectively led to reduced A5 and A6 segment t_MSE activity and an ectopic t_MSE activity in the A4 and A3 segments. Compared to Ddc-MEE1 activity in a (I) control genetic background, suppression of (J) grh expression resulted in a conspicuous loss of Ddc-MEE1 activity in the A5 and A6 segments, whereas suppression of (K) abd-A and (L) hth respectively had little to no effect on A5 and A6 segment Ddc-MEE1 activity, nor any ectopic activity in the A4 and A3 segments. Yellow arrowheads indicate segments where the genetic background alterations resulted in conspicuous ectopic EGFP reporter expression. Red arrowheads indicate segments where the genetic background alterations resulted in a reduced EGFP reporter expression.

