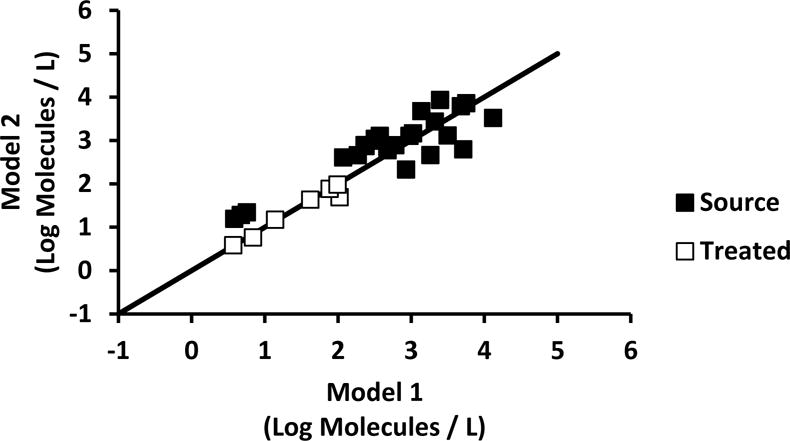
Figure 3. Confirmation of Model 2 using a beta distribution.

Confirmation of Model 2 using a beta distribution inferred from EAC PCR inhibition. Diagonal line represents axis of symmetry showing the agreement of Model 1 and Model 2 virus estimates. Model 1 used the EAC relative error paired to each DWTP sample. The log molecules represent virus genome molecules.
