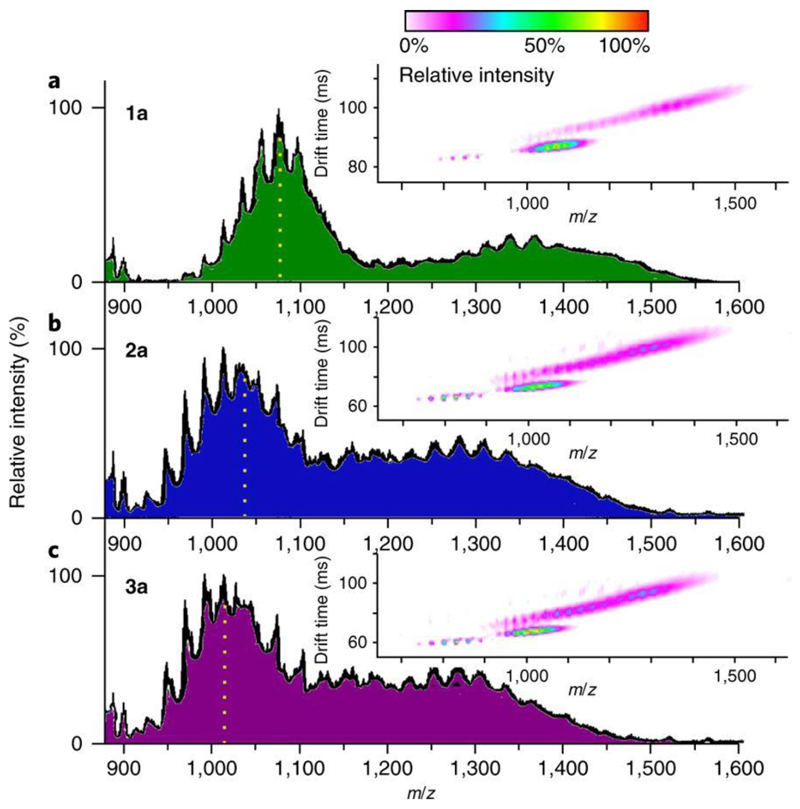
Figure 4. Mass spectrometry data showing the stability of the compounds.
a–c, ESI-IM-MS of compounds 1a (a), 2a (b) and 3a (c). Left axis shows relative intensity. The insets show the drift time for the different −4 and −3 species plotted against m/z. The dotted vertical lines indicate the centre of the group of envolopes once separated from the –3 group of envelopes at a higher m/z value. For more information, see Supplementary Section 3.

