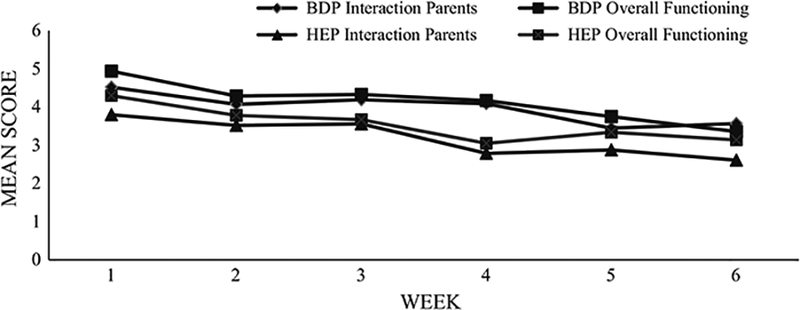
Fig. 1.

Impairment Rating Scale. This figure illustrates the weekly impairment trajectory of Behavior Development Program (BDP) and Healthy Emotions Program (HEP). Mean scores are depicted for youth’s interaction with parents as well as their overall level of functioning. It should be noted that BDP n’s ranged from 21 to 31 respondents across Weeks 1 through 6, while HEP n’s ranged from 14 to 27
