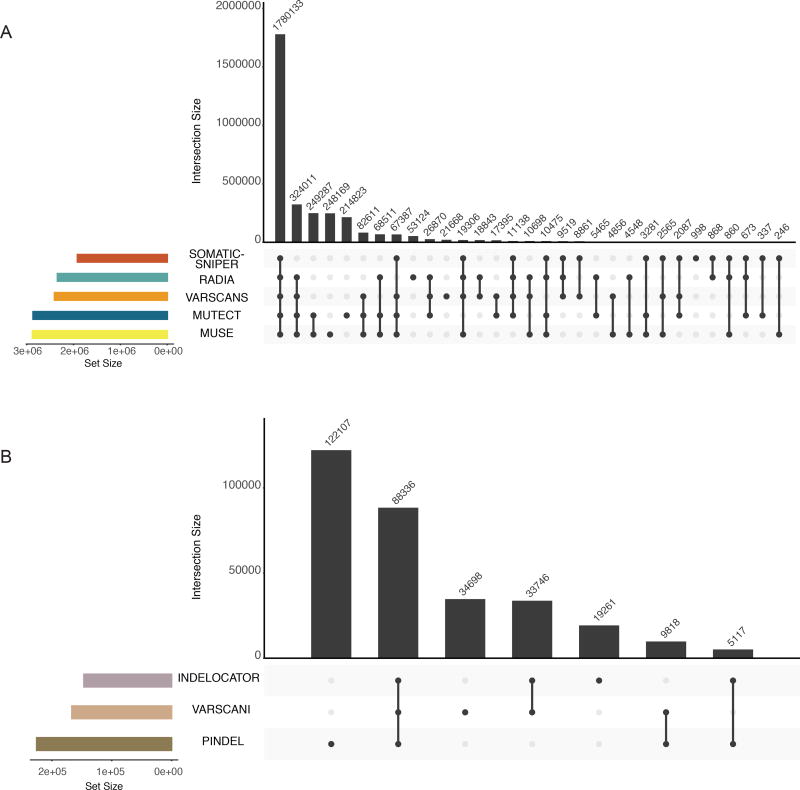
Figure 5. Intersection of mutation calls across variant prediction software.
The top bar-plot indicates intersection size. More specifically, one or more tools called each variant. This plot provides the number of variants that are uniquely called by one tool (a single point) or the numbers of variants called by many tools (2 or more points). The bottom left plot indicates the set size. The linked points below display the intersecting sets of interest or which tools called variants. A) PASS only mutations from the controlled MAF are shown. B) Tools designed to call indels are displayed in a similar fashion to plot A. Only indels with greater than 3 supporting reads are displayed in this plot. Additionally, two samples were removed from these plots that represent extreme hypermutators (TCGA-D8-A27V, and TCGA-EW-A2FV).

