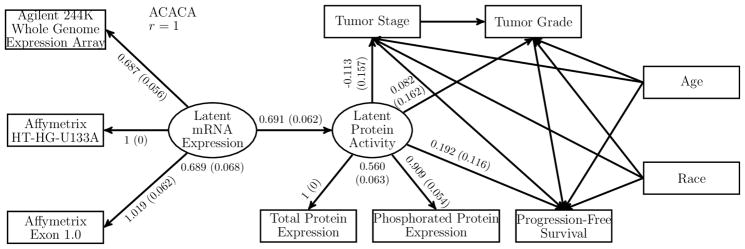
Figure 4.
Results from the SEM Analysis of the Gene ACACA. Analysis results are from 542 patients with ovarian cancer in the TCGA project. The numbers besides an arrow correspond to the point estimate and standard error estimate (in parentheses) of the regression parameter. The numbers below the latent variables correspond to the point estimate and standard error estimate (in parentheses) of the error variance.

