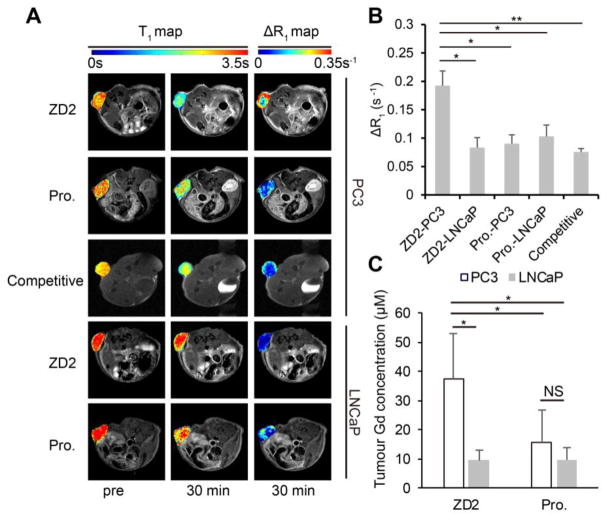
Figure 6. T1 maps and accumulation of ZD2-Gd(HP-DO3A) validate its specific binding in PC3 tumors.
A, T1 and ΔR1 maps showing the tumor T1 and ΔR1 values in PC3 or LNCaP tumor models injected with ZD2-Gd(HP-DO3A) (abbreviated as ZD2) or ProHance (abbreviated as Pro.) at pre-contrast (pre) or 30 min post-injection. Images are displayed as overlays of tumor color-coded maps and axial T1-weighted images. B, quantification of average ΔR1 after contrast injection in the groups shown in A (n = 4; *, P < 0.05, **, P < 0.01). C, comparison of contrast agent accumulation in the tumors, as measured by ICP-OES at 30 min after contrast agent injection (unpaired two-tailed t-test: n = 4; *, P < 0.05; NS: not significant).

