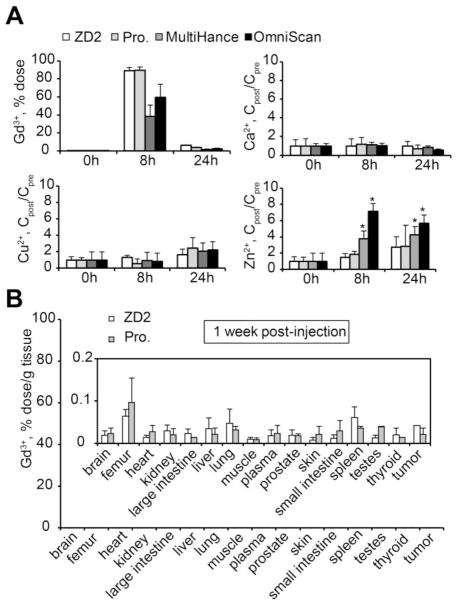
Figure 7. In vivo transmetallation and biodistribution of MRI contrast agents after intravenous administration.
A, Gd3+ content in urine before and at 8 h and 24 h after ZD2-Gd(HP-DO3A), ProHance, MultiHance, or OmniScan injections. B, Gd biodistribution in mouse tissues at 1 week after injection of ZD2-Gd(HP-DO3A) (n = 4) or ProHance (n = 3). Gd3+ content is represented as the ratio of dose injected to the weight of the tissue. Inset: biodistribution data shown with a shorter-scale on the Y-axis. No significant difference was seen between the two groups.

