
Figure 1. Comparison of RCC Histologic Subtypes.
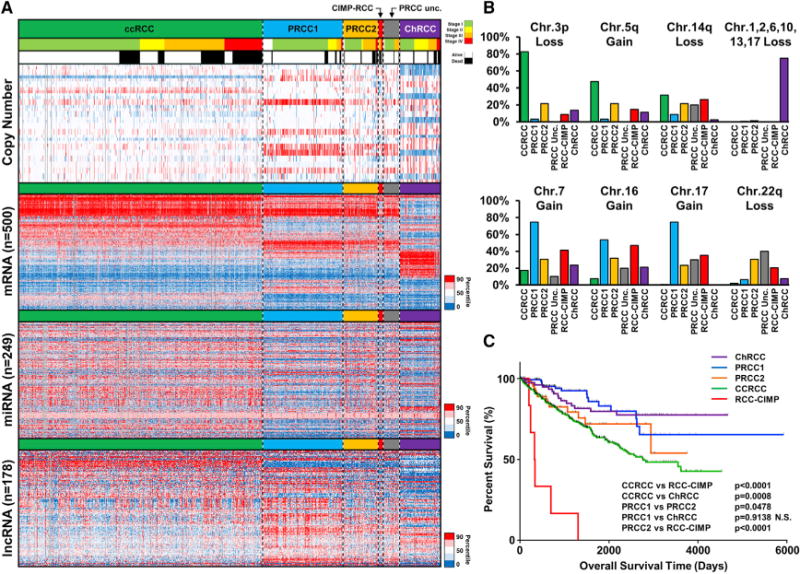
(A) Heatmap representation of chromosomal copy number and RNA expression profiles between the different histologic RCC subtypes. Chromosomal copy number data are ordered by chromosomal arm in descending order (red, gain; blue, loss). The relative RNA expression was assessed for the most variable probes within the complete RCC cohort for either mRNA (n = 500), miRNA (n = 249), or lncRNA (n = 178) (red, increased; blue, decreased). RCC samples were arrayed left to right based on histologic subtype (ccRCC, green; type 1 PRCC, light blue; type 2 PRCC, orange; unclassified [Unc.] PRCC, gray; CIMP-RCC, red; ChRCC, purple), then tumor stage (stage I, light green; stage II, yellow; stage III, orange; stage IV, red), and then vital status (alive, white; deceased, black). (B) Percentage of chromosomal copy number alterations between the different histologic RCC subtypes. (C) Differences in patient overall survival between the different histologic RCC subtypes (log-rank p value).