
Figure 4. RCC Histologic Subtypes Associate with Specific mRNA Signatures.
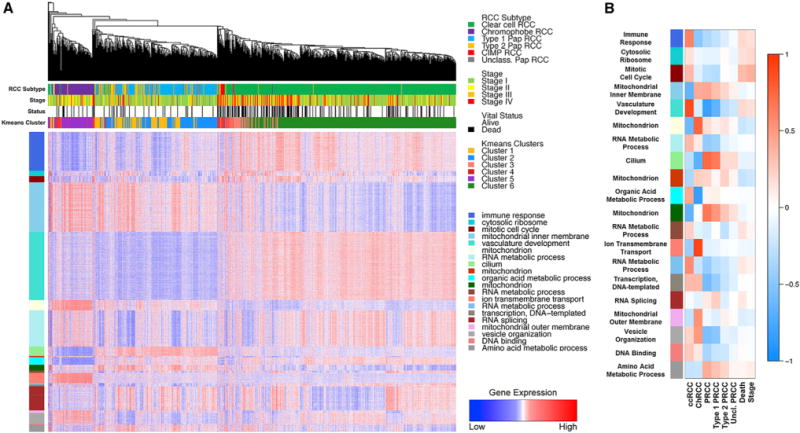
(A) Heatmap representation of the comparison of mRNA expression signatures for major cellular processes between the different histologic RCC subtypes (ccRCC, green; type 1 PRCC, light blue; type 2 PRCC, orange; Unc. PRCC, gray; CIMP-RCC, red; ChRCC, purple). Tumor stage (stage I, light green; stage II, yellow; stage III, orange; stage IV, red) and vital status (alive, white; deceased, black) are indicated above the heatmap. (B) Heatmap representation showing the relationship between gene expression modules and clinical features. Red heatmap shading indicates a positive correlation between a gene module and a clinical feature and blue heatmap shading represents a negative correlation.