
Figure 5. Metabolic Analysis of RCC Histologic Subtypes.
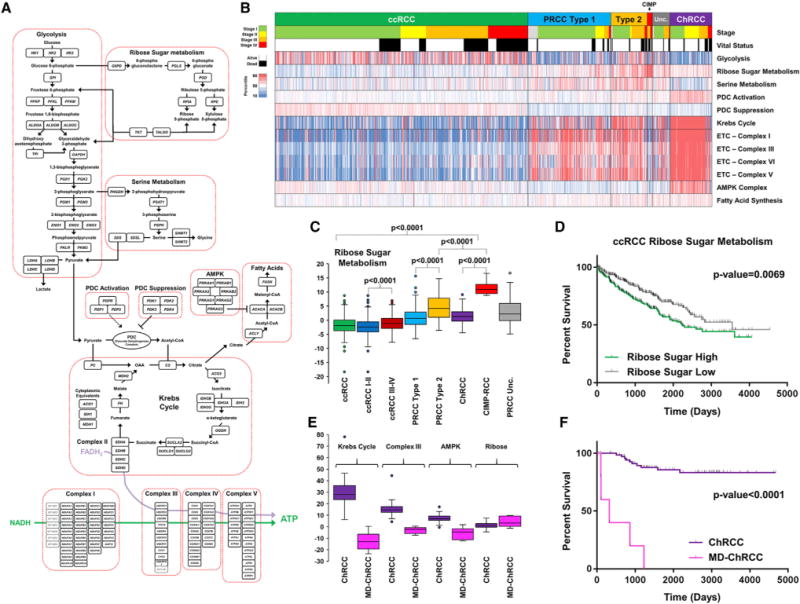
(A) Schematic of metabolic pathway genes selected for metabolic analysis. (B) Heatmap representation of the comparison of mRNA expression signatures for the selected metabolic processes between the different histologic RCC subtypes (ccRCC, green; type 1 PRCC, light blue; type 2 PRCC, orange; Unc. PRCC, gray; CIMP-RCC, red; ChRCC, purple). Tumor stage (stage I, light green; stage II, yellow; stage III, orange; stage IV, red) and vital status (alive, white; deceased, black) are indicated above the heatmap. (C) Comparative expression of the ribose sugar metabolism signature between the different histologic RCC (ccRCC, green; ccRCC stage I/II, dark blue; ccRCC stage III/IV, dark red; type 1 PRCC, light blue; type 2 PRCC, orange; Unc. PRCC, gray; CIMP-RCC, red; ChRCC, purple). (D) Differences in patient overall survival within ccRCC dependent upon expression of the ribose sugar metabolism signature (log-rank p value). (E) Comparative expression of the Krebs cycle, ETC Complex III, AMPK, and ribose sugar metabolism gene signatures between ChRCC and metabolically divergent (MD) ChRCC (ChRCC, purple; MD-ChRCC, pink). (F) Differences in patient overall survival between ChRCC and MD-ChRCC (log-rank p value).