
Figure 6. Immune Signature Analysis.
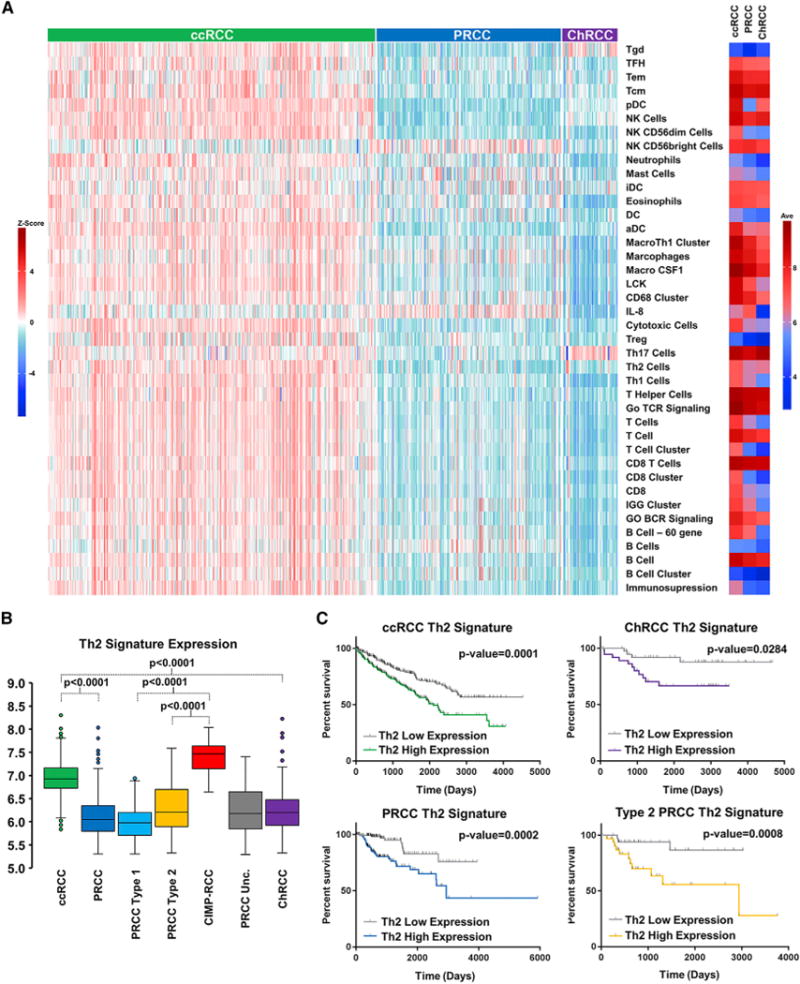
(A) Supervised clustering of immune gene signature (IGS) expression by individual sample (left) or mean IGS expression (right) for the different histologic RCC subtypes (ccRCC, green; PRCC, blue; ChRCC, purple). (B) Comparative expression of the Th2 gene signature between the histologic RCC subtypes (ccRCC, green; PRCC, blue; type 1 PRCC, light blue; type 2 PRCC, orange; CIMP-RCC, red; unclassified PRCC, gray; ChRCC, purple) (t test). (C) Comparative differences in patient overall survival within the histologic RCC subtypes (ccRCC, green; PRCC, blue; type 2 PRCC, orange; ChRCC, purple) dependent upon the Th2 gene signature (log-rank p value).