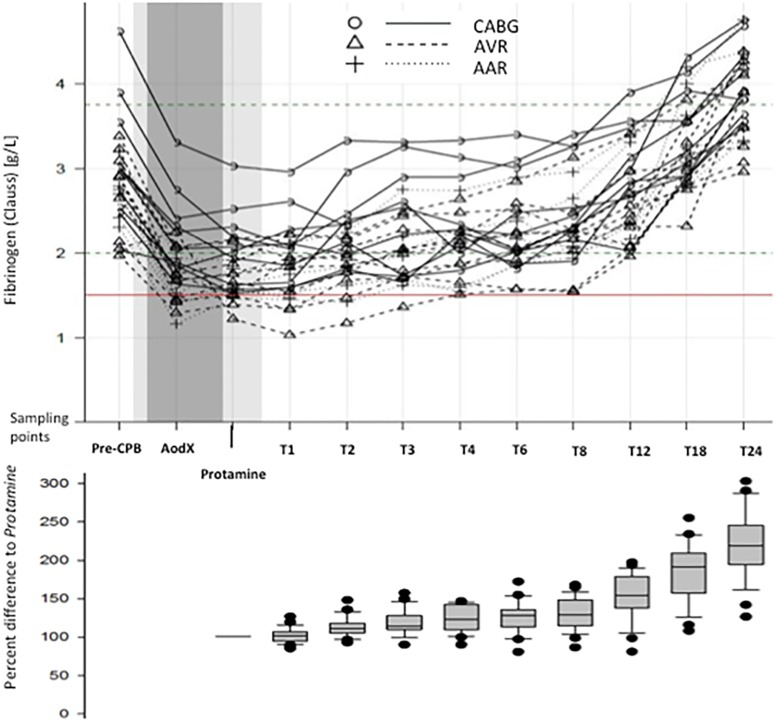
Fig 2. Fibrinogen concentration at the sampling points and changes in relation to time point Protamine.
Clauss fibrinogen concentration in all patients during the observation period (upper graph), and relative post-CPB change as percent difference from levels at time point Protamine (lower graph). In the upper graph the light grey shaded area indicates the period of surgery. Time on CPB is shaded dark grey. The red horizontal line indicates Clauss fibrinogen at 1.5 g/L. Note that true time intervals increase between sequence points T1 and T24.

