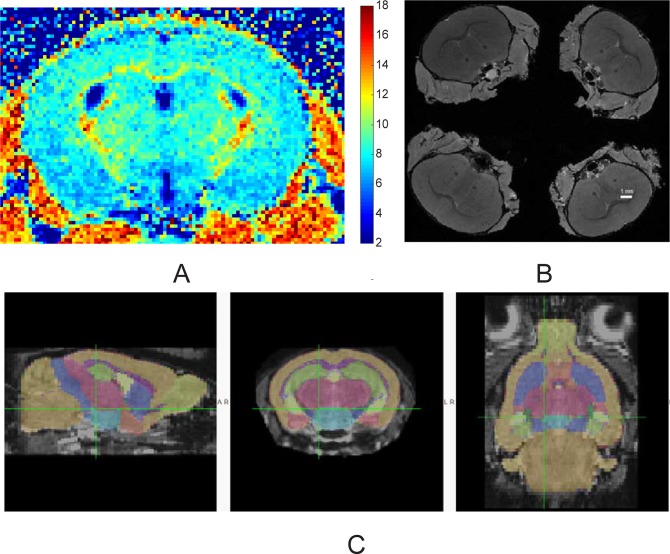
Fig 1. MRI methods.
(A). Macromolecular proton fraction map of four weeks old mouse. Color bar indicates pseudo-color mapping of MPF in percent units. (B). High resolution T1-weighed volumes of ex-vivo mouse brain images with skulls in situ. A group of four brains were imaged at the same time. (C). Automatic structural parcellation of a mouse brain obtained from MT image using multi-atlas label fusion method.

