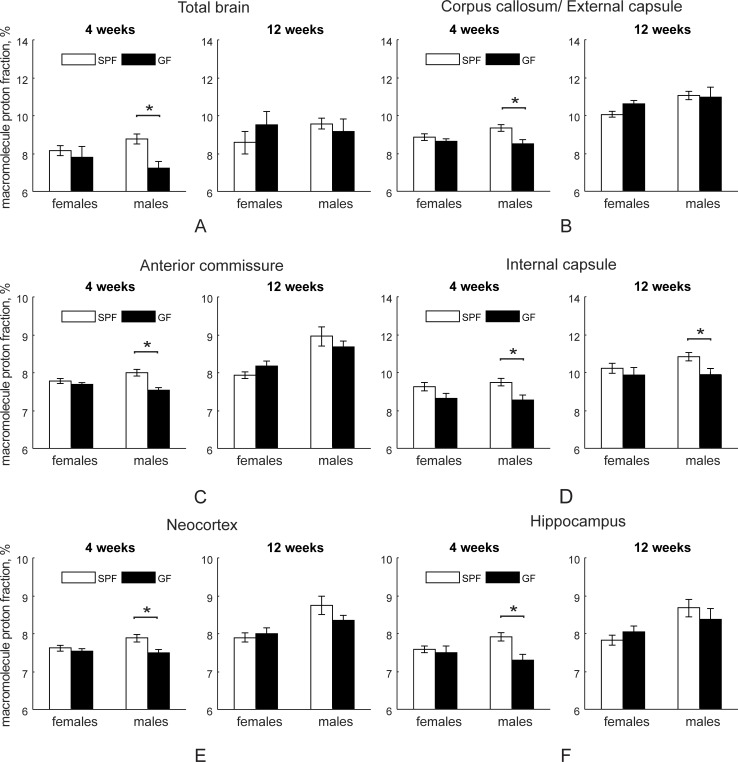
Fig 5. Macromolecule proton fraction (in percentage) in SPF and GF mice.
Animal numbers at four (n = 15 for both female and male SPF mice; n = 6 for female and n = 9 for male GF mice) and 12 (n = 13 for both female and male SPF and n = 7 for both female and male GF mice) weeks of age. Asterisks indicate significant differences when p-value is at least <0.05 in between the groups in post-hoc comparisons where treatment group factor of two-way ANOVA for each testing age was significant.

