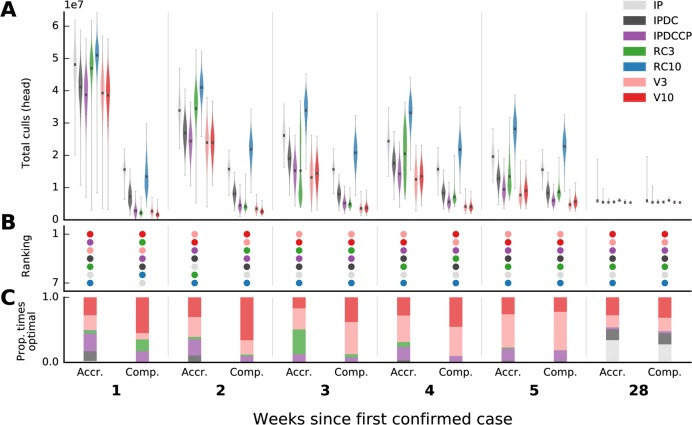
Fig 2. Projections and relative rankings of various control strategies of total animals culled, and estimates of infected but undetected farms, for the first five weeks and the final week of the 2001 foot-and-mouth disease outbreak in UK.
A) Distribution of total animal culls from forward simulations, here shown as kernel density estimates (violin plots), are seeded either using parameter estimates from the end of the outbreak (Comp.; ‘complete’), or at the specific time point (Accr.; ‘accrued’). B) Rankings of control interventions are according to mean projections. Proportion (C) of times each control was optimal when bootstrap samples are made from distributions in (A). For all time points see S9 and S10 Figs.

