
Figure 3.
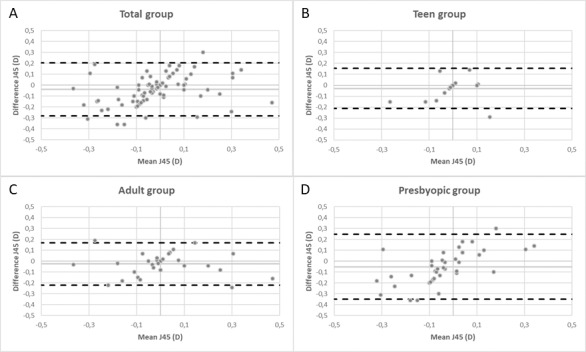
Bland-Altman plots between mean J45 of EYER and subjective refraction for total group (A), teenagers (B), adults (C), and presbyopic (D) group. The middle line indicates the mean difference (EYER - subjective refraction), and the two dashed side lines show the 95% limits of agreement.