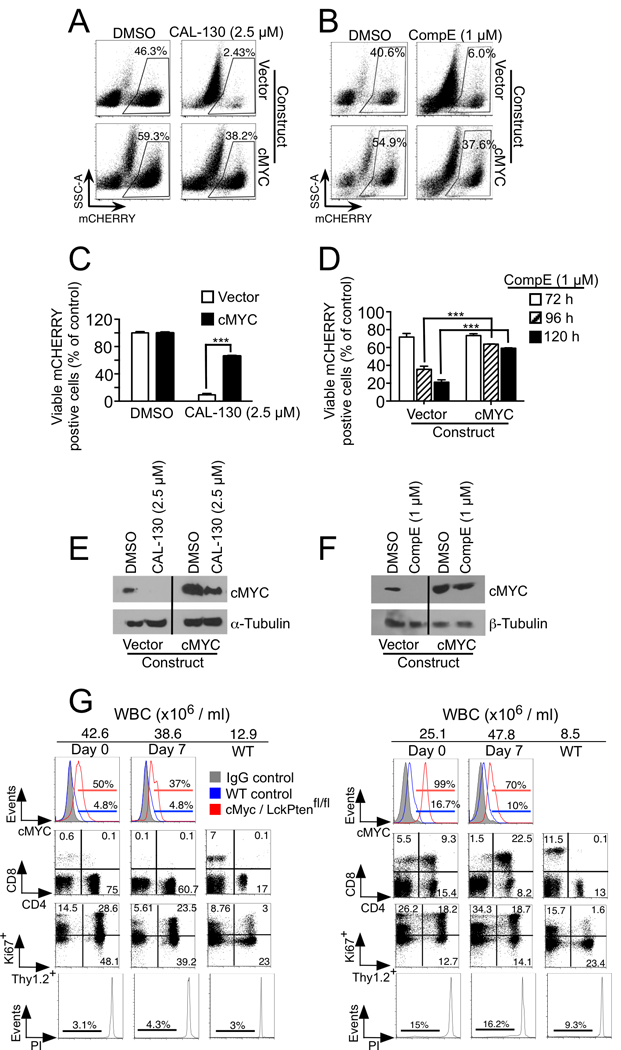
Figure 4.

Overexpression of cMYC results in resistance to CAL-130 and GSI treatments. A-D, FACS dot plots (A and B) and viability bar graphs (C and D) of a representative CD2-Lmo2-driven T-ALL cell line (03007) transfected with mCherry-expressing empty or WT cMYC vector and treated with CAL-130 (72 hours), CompE (27, 96 and 120 hours) or DMSO control. Data represent mean ± SEM (***, P < 0.0001; n = 3, t test). cMYC protein expression in the same cells treated with CAL-130 (E) or CompE (F) for 24 and 48 hours, respectively. G, Flow cytometric analysis of disease status in two representative (n = 5) Gt(ROSA)26Sortm13(CAG-MYC, -CD2*)Rsky/J; Lck-cre/Pten(fl/fl) mice immediately before and 7 days after initiating treatment with dual PI3Kγ/δ inhibitor CAL-130 (10 mg/kg every 8h) for 7 days. Tumor drug response was determined by assessing for changes in circulating blasts (Thy1.2+/Ki67+) and propidium iodide (PI)-staining.
