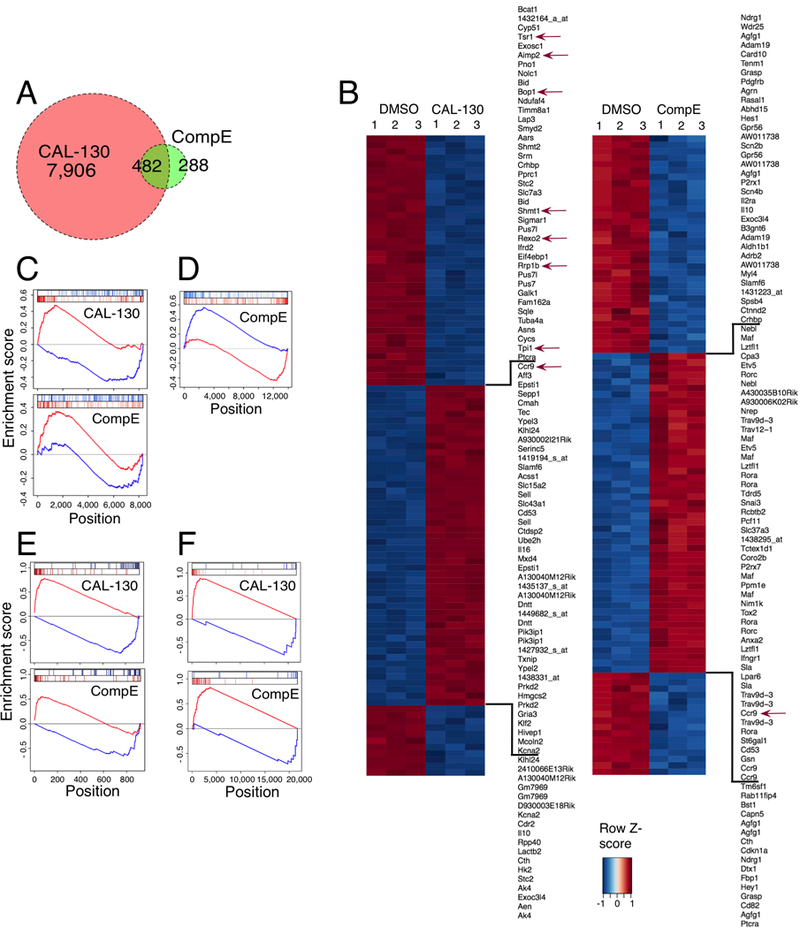
Figure 5.

Blockade of PI3Kγ/δ activity reverses the oncogenic signature of Lmo2-driven T-ALL. A, Venn diagram comparing the number and overlap of genes altered by PI3Kγ/δ blockade (red circle) or GSI (green circle) using FDR < 0.0005 as cut off. Gene expression profiling was performed on triplicate samples of the CD2-Lmo2 T-ALL cell line (03007) treated with either CAL-130 (2.5μM, 10 hours) or CompE (1μM, 48 hours) as compared to DMSO control. B, Heat map representation of the top 100 differentially expressed genes (FDR < 0.00001) between DMSO and CAL-130 or CompE treated tumor cells. The scale bar shows color-coded differential expression, with red and blue indicating higher and lower levels of expression, respectively. Red arrows denote cMYC-regulated genes. C, Enrichment of top 100 activated and repressed genes from Lmo2-driven T-ALL disease signature (T-ALL versus WT mouse thymocytes) on the CAL-130 (top) and CompE (bottom) activity gene signature. Repressed genes are shown in blue, and over-expressed genes are shown in red. D, Comparison of GSI treatment signature for tumor cells (top 200 up and down regulated genes) on the consensus GSI perturbational signature obtained from the expression profiles (GSE5827) of seven human T-ALL cell lines treated with DMSO or CompE. E, Enrichment of top 40 activated and repressed T-ALL master regulator TFs (as inferred by ViPER based on the Lmo2-driven T-ALL versus WT murine thymocyte signature) on the CAL-130 (top) and CompE (bottom) activity signature, respectively. F, Enrichment of cMYC-regulated genes on the sorted CAL-130 (top) and CompE (bottom) treatment gene signature.
