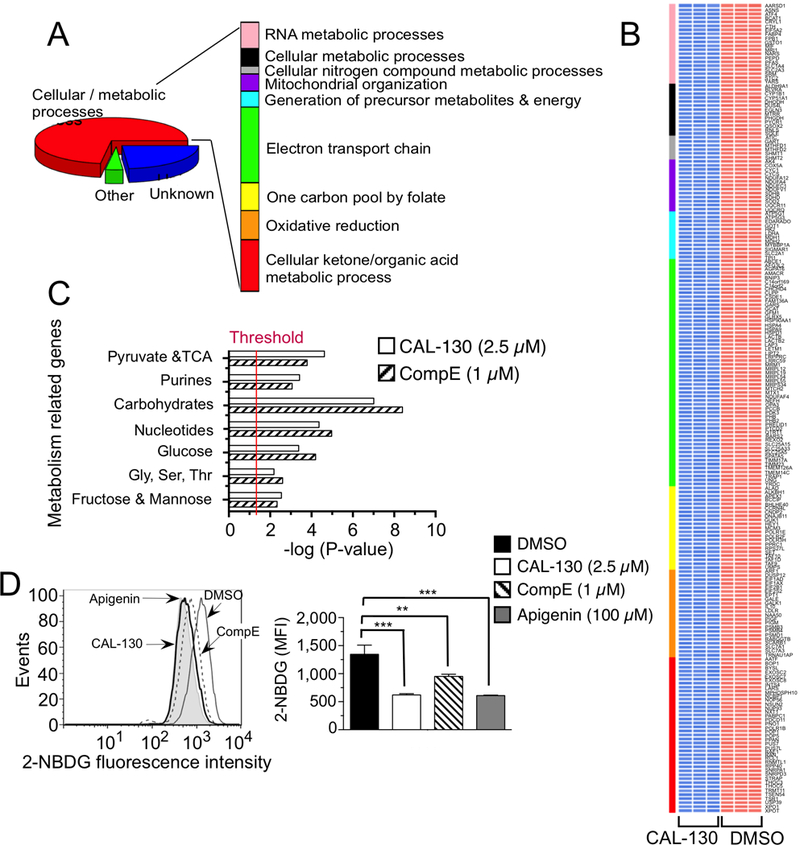
Figure 6.

PI3Kγ/δ and NOTCH1 regulate metabolic pathways that contribute to the oncogenic programming of Lmo2-driven T-ALL. A, Functional annotation of top 297 genes down regulated (P < 0.00001) in a CAL-130 (2.5 μM, 10 h) treated CD2-Lmo2 T-ALL cell line (03007) using DAVID. Pathways with Benjamini Hochberg corrected P < 0.05 are shown. B, Heat map of metabolism-related gene expression profiles after CAL-130 or vehicle (DMSO) treatment (in triplicate). Colored bar denotes pathways annotated in A, and red and blue indicate high and low levels of gene expression, respectively. C, Summary of GSEA performed on the ranked genes according to the ratios of transcripts from DMSO, CAL-130 (2.5 μM, 10 h) or CompE (1μM, 48 h) treated cells. Six metabolic gene sets with P < 0.01 and a false discovery rate (FDR) of <0.05 (represents threshold) were considered significant. D, Inhibition of glucose uptake by PI3Kγ/δ blockade or NOTCH1 inhibition. Histograms (upper) and mean fluorescence intensity (MFI, lower) of 2-NBDG incorporation into tumor cells treated with DMSO, CAL-130 (2.5 μM, 14 h) or CompE (1μM, 72 h). Apigenin (100μM, 30 min treatment), an inhibitor of Glut1 expression, was used as a positive control. Data represent mean ± SEM (**, P < 0.01, ***, P < 0.001 relative to DMSO; n = 3, t test).
