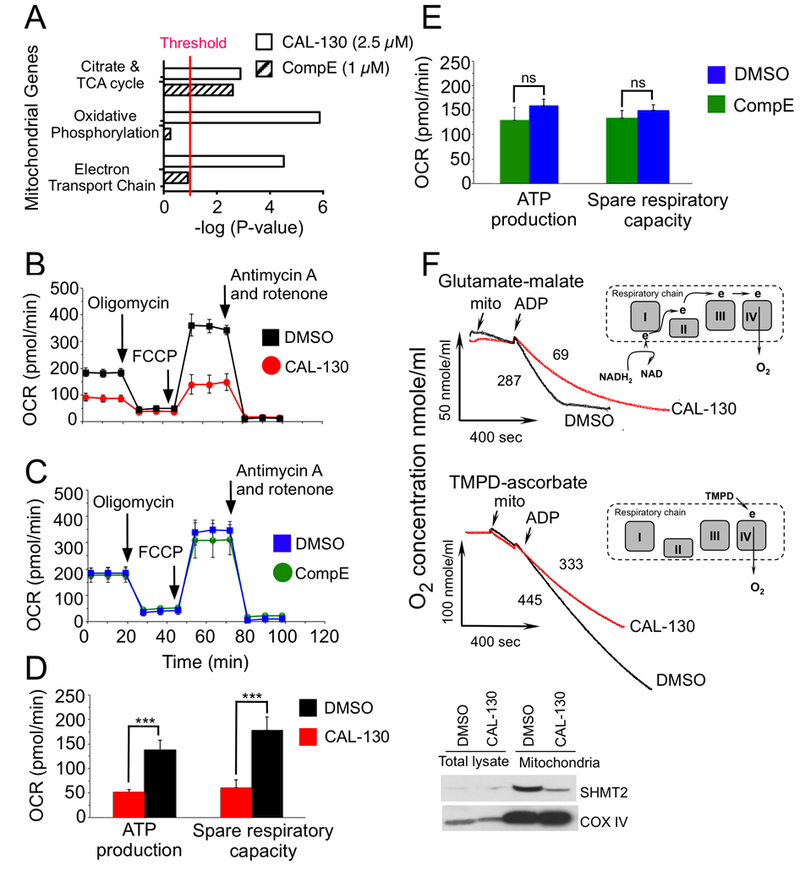
Figure 7.

PI3Kγ/δ regulate distinct bioenergetic pathways that contribute to the oncogenic programming of Lmo2-driven T-ALL. A, Summary of mitochondrial GSEA analysis performed on the ranked genes according to the ratios of transcripts from DMSO, CAL-130 (2.5 μM, 10 h) or CompE (1μM, 48 h) treated cells. Gene sets with a P < 0.01 and a false discovery rate (FDR) of < 0.05 (represents threshold) were considered significant. B and C, Oxygen consumption rates (OCR) in the same cell line treated with DMSO vs. CAL-130 (2.5μM) for 12 hours (B) or DMSO vs. CompE (1μM) for 48 hours (C) under basal conditions and in response to the indicated mitochondrial inhibitors. Changes after oligomycin and FCCP application are indicative for respiration linked to ATP synthesis and the maximal respiratory capacity, respectively. D and E, ATP production and spare respiratory capacity in CAL-130 (D) or CompE (E) treated tumor cells. Data represent mean ± SEM (***, P < 0.0001, n = 3, t test). F, Respiration of mitochondria isolated from a CD2-Lmo2 T-ALL cell line (03007) following exposure to CAL-130 (2.5 μM, 12 hours) or DMSO and supported with two different substrates: complex-I dependent glutamate-malate (upper panel) or complex-IV linked substrate, TMPD-ascorbate (lower panel). Red and black tracings denote drug and DMSO treated cells, respectively. The points of initiation of resting, phosphorylating and uncoupled respirations are indicated (arrows). The values of the phosphorylating respiration rates (PRR) are provided. Schematic substrate-dependent changes in electron supply for mitochondrial respiratory chain is presented above each tracing. Insert shows western blot analysis for the mitochondria expressed SHMT2 protein in treated tumor cells.
