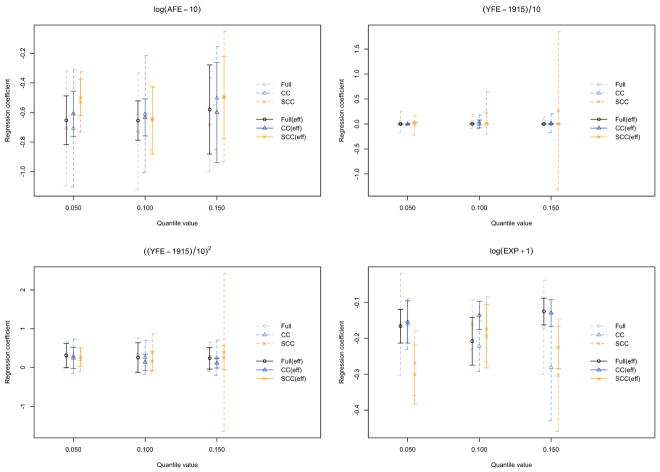
Figure 2.
Estimated quantiles of population survival times for the South Wales nickel refinery dataset. The black, blue, and orange solid lines correspond to the point estimates based on the samples obtained from the full cohort, classical case-cohort sampling scheme, and stratified case-cohort sampling scheme, respectively. Their associated pointwise 95% confidence intervals are presented by (dotted) lines of the same colors.

