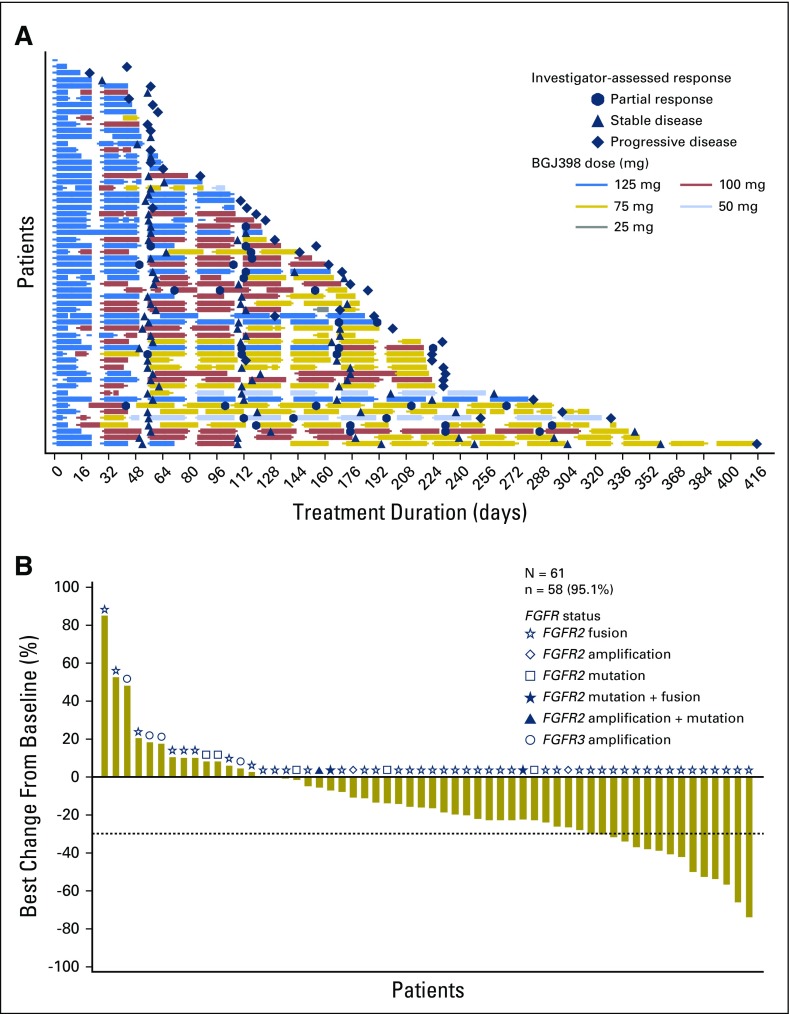
Fig 1.
(A) Duration of exposure. Swimplot presenting duration of exposure, dosing history, and efficacy assessments. (B) Best percentage change in sum of longest tumor diameters from baseline. Only patients with baseline and at least one postbaseline assessment are included. N, number of patients who received at least one study treatment; n, number of patients with baseline and at least one postbaseline assessment.

