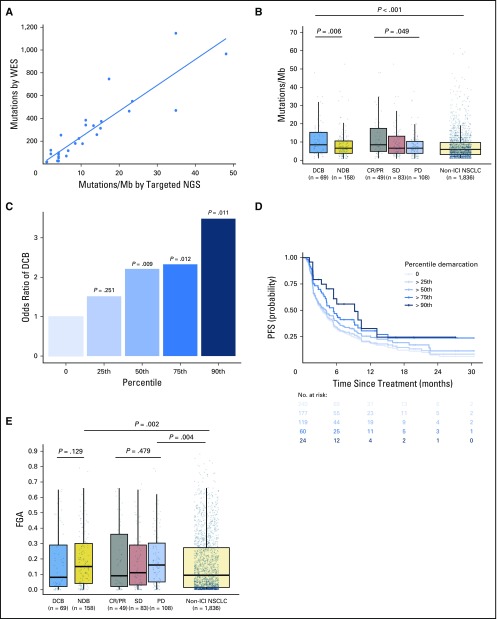
Fig 1.
Somatic molecular features associated with response to immunotherapy. (A) Tumor mutation burden (TMB) assessed by targeted next-generation sequencing (NGS) correlates with TMB assessed by whole-exome sequencing (WES; n = 49, Spearman ρ = 0.86; P, .001). Individual tumors are shown as dots. The line depicts the best fit. (B) Somatic nonsynonymous TMB is greater in durable clinical benefit (DCB) versus no durable benefit (NDB; median, 8.5 v 6.6 single-nucleotide variants/megabase [Mb]; P = .006) and is significantly different in those with complete response (CR)/partial response (PR) versus stable disease (SD) versus progressive disease (PD; median, 8.5 v 6.6 v 6.6 single-nucleotide variants/Mb; P = .049). The distribution of TMB in patients with non–immune checkpoint inhibitor (ICI)–treated non–small-cell lung cancer (NSCLC) are shown for reference. TMB in patients with DCB was similar to those with CR/PR (P = .85) and greater in those with non-ICI NSCLC (P, .001). Box plots represent medians, interquartile ranges, and vertical lines extend to the 95th percentiles. TMB of individual patients are represented with light dots. (C) Odds ratio (OR) of DCB with increasing cut points of TMB.25th (OR, 1.75), 50th (OR, 2.02), 75th (OR, 2.06), and 90th (OR, 3.24) percentiles. The 0 percentile (white bar) is shown for reference of all patients (default OR, 1). The odds of DCB increase significantly above the 50th percentile of TMB. (D) Individual Kaplan-Meier curves of progressionfree survival (PFS) above each percentile at increasing thresholds of TMB. PFS in patients with NSCLC treated with anti–programmed cell death-1– or anti–programmed deathligand 1–based therapy increaseswith increases inTMB. (E) Fraction of copy number–altered genome (FGA) inDCBversusNDB(median, 0.08 v 0.15;P = .129) and PR/CR versus SD versus PD (median, 0.09 v 0.11 v 0.16; P = .479). FGA is enriched among those with PD or NDB compared with non-ICI NSCLC (P = .004 and .002, respectively).

