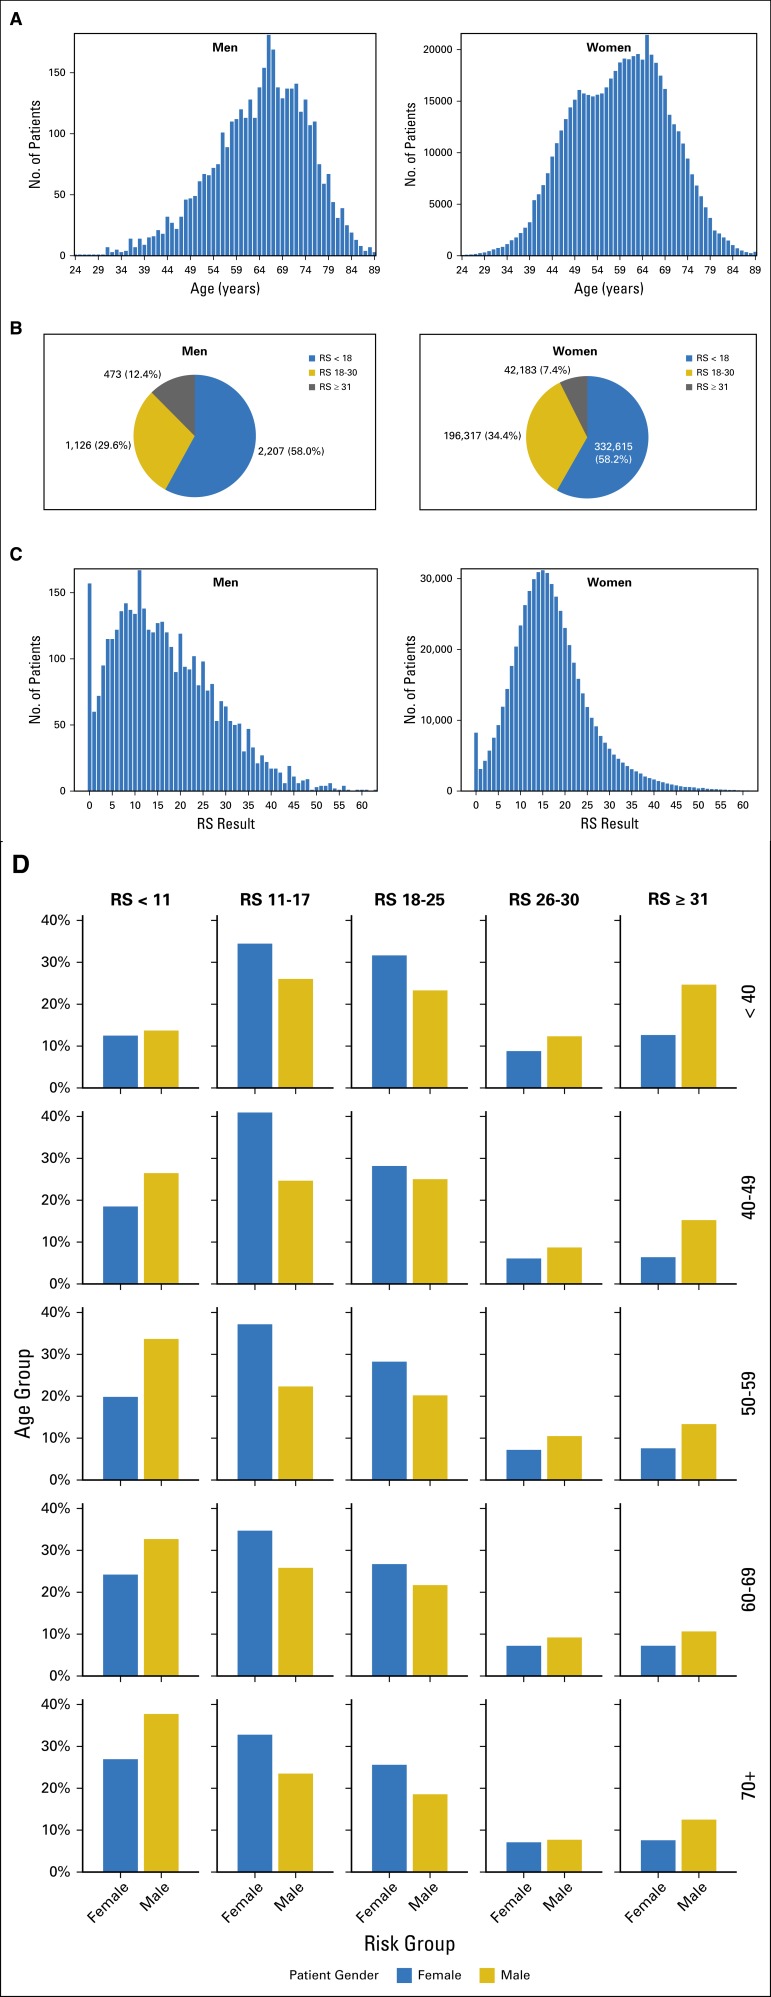
Fig 1.
Age and Recurrence Score (RS) distribution in men (n = 3,806) and women (n = 571,115). (A) The number of patients plotted on the y-axis against age on the x-axis for men (left side of graph) and women (right side of graph). (B) A pie chart for the breakdown of RS distribution in men (left side) versus women (right side), with RS < 18 in blue, RS 18-30 in gold, and RS ≥ 31 in gray. (C) The number of patients on the y-axis plotted against RS results on the x-axis for men (left side of graph) and women (right side of graph). (D) RS by age group on the y-axis against gender on the x-axis. Age groups plotted are < 40, 40 to 49, 50 to 59, 60 to 69, and ≥ 70 years, with proportion of RS ranges (RS < 11, RS 11-17, RS 18-25, RS 26-30, and RS ≥ 31) shown for each age group. Men are represented in gold and women in blue.

