. 2018 Jul 10;7:e38268. doi: 10.7554/eLife.38268

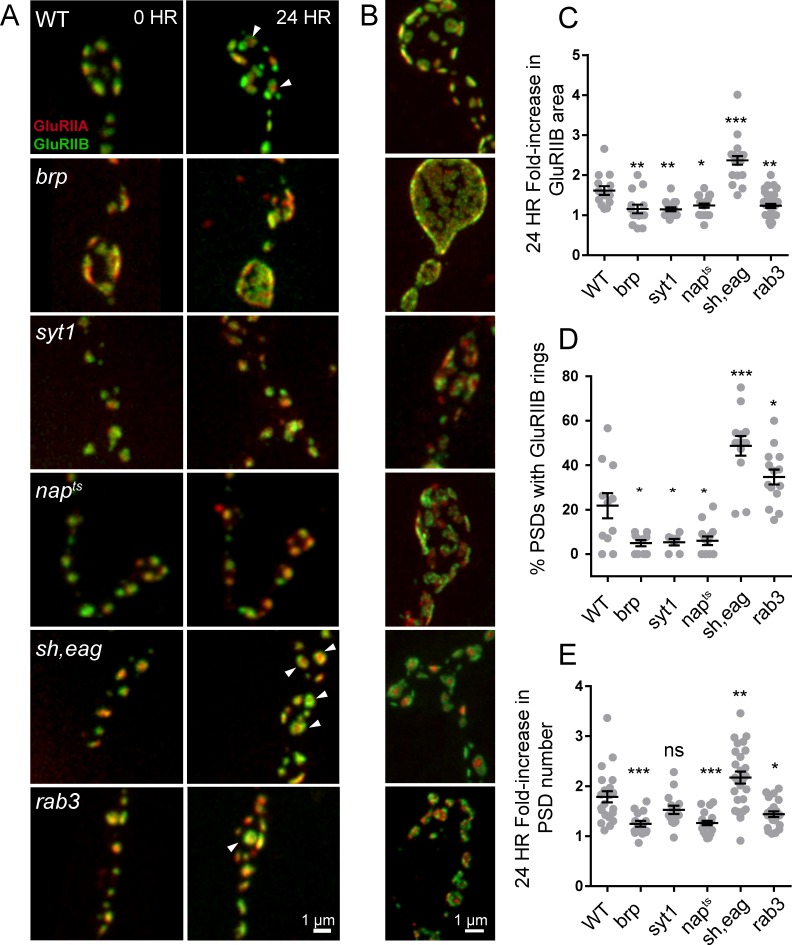
Figure 10. Glutamate receptor field maturation in mutants with altered presynaptic activity.

(A) Representative NMJs on muscle 26 for each genotype imaged intravitally over 24 hr; the 0 hr timepoint (left column) corresponds to imaging during the early first instar stage. White arrows (24 hr) denote PSDs that have acquired GluRIIA/IIB segregation at this time point. (B) Representative third instar PSDs. (C) Fold-increase in GluRIIB area over 24 hr in newly formed PSDs. (D) Percent of PSD fields with GluRIIB rings at the second instar stage. A PSD was considered to have a GluRIIB ring if the line profile through the GluRIIB field had a central dip in fluorescence intensity of greater than 10%. (E) Fold increase in PSD number, defined by the number of GluRIIB puncta, over 24 hr of imaging beginning in the first instar stage. (C–E) Each point represents the average from one NMJ. One way ANOVA followed by Dunnett’s multiple comparisons test was used for statistical analysis (*=p ≤ 0.05, **=p ≤ 0.01, ***=p ≤ 0.001). Error bars represent SEM.

Figure 10.

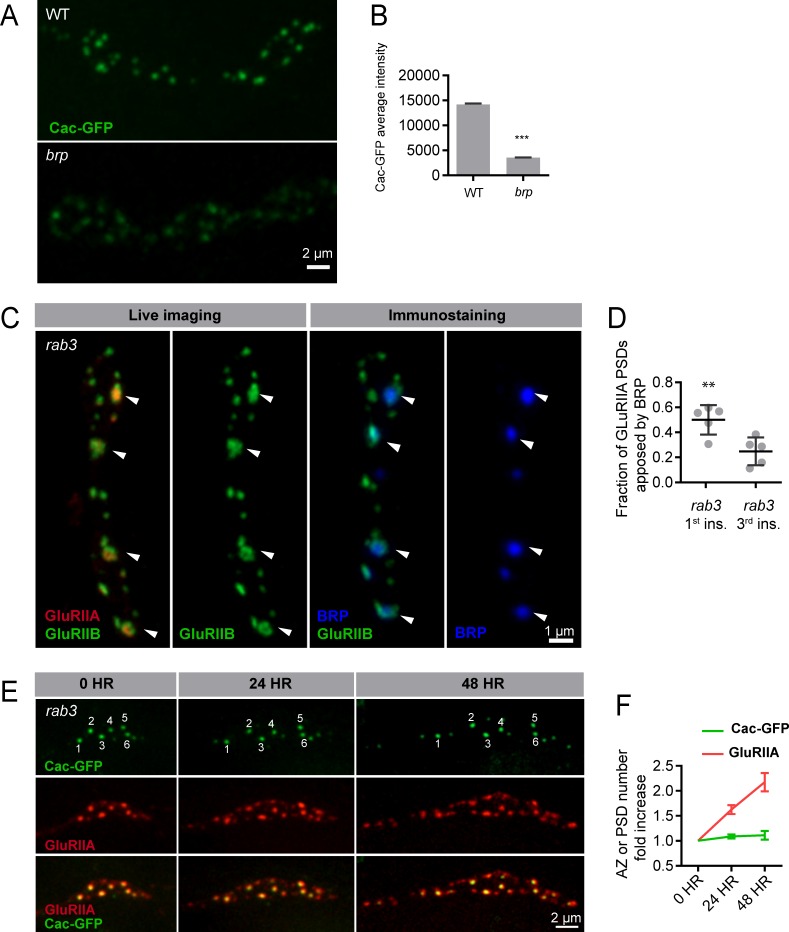
Figure 10—figure supplement 1. Synapse development in Rab3 mutants.

Figure 10—figure supplement 1.

(A) Representative images of UAS-Cac-GFP driven in neurons using elav-Gal4 in control and brp69/def backgrounds. (B) Cac-GFP average intensity per AZ in control and brp69/def backgrounds. (C) Muscle 26 of rab3 first instar animals expressing GluRIIA-RFP and GluRIIB-GFP imaged live (left two panels) and then fixed and immunostained for BRP (blue; right two panels). Arrows denote release sites with mature glutamate receptor fields; these sites are enriched in BRP. (D) Fraction of GluRIIA PSDs apposed by AZs containing BRP in first instar vs. third instar rab3 larvae. (E) Rab3 animals expressing UAS-Cac-GFP and GluRIIA-RFP followed intravitally over 48 hr of development, beginning in the first instar stage (day 1). Numbers (top row) mark AZs enriched in Cac-GFP on day 1, showing these AZs remain stably enriched for Cac-GFP throughout the 48 hr imaged. (F) Fold increase in number of GluRIIA puncta (red) and Cac-GFP puncta (green) every 24 hr. Student’s t-test was used for statistical analysis (***=p ≤ 0.001). Error bars represent SEM.