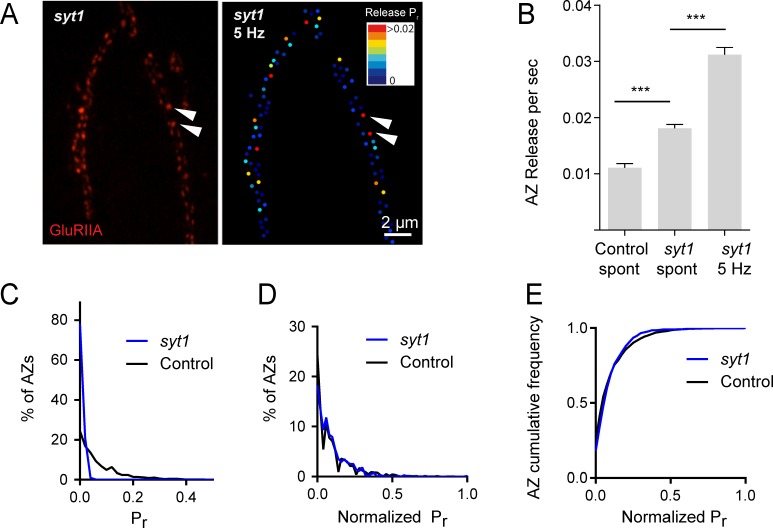
Figure 2. Pr variability remains in syt1 null mutants.
(A) The left panel displays the distribution of GluRIIA in syt1 nulls (left panel) at the muscle 4 NMJ. The corresponding Pr heatmap is shown on the right. The arrows denote several high Pr sites opposed by bright GluRIIA positive PSDs. (B) AZ release events per second for spontaneous release and evoked by 5 Hz stimulation are shown for syt1 nulls mutants, and for spontaneous release in controls. (C) Frequency distribution of Pr is shown for syt1 nulls and controls. (D) Plot of normalized Pr frequency distribution (from 0 to 1 (max)) for syt1 nulls and controls. (E) Cumulative frequency distribution for normalized release rates for syt1 nulls and controls is shown. One-way ANOVA followed by Dunnett’s multiple comparisons test used for statistical analysis (***=p ≤ 0.001). Error bars represent SEM.

