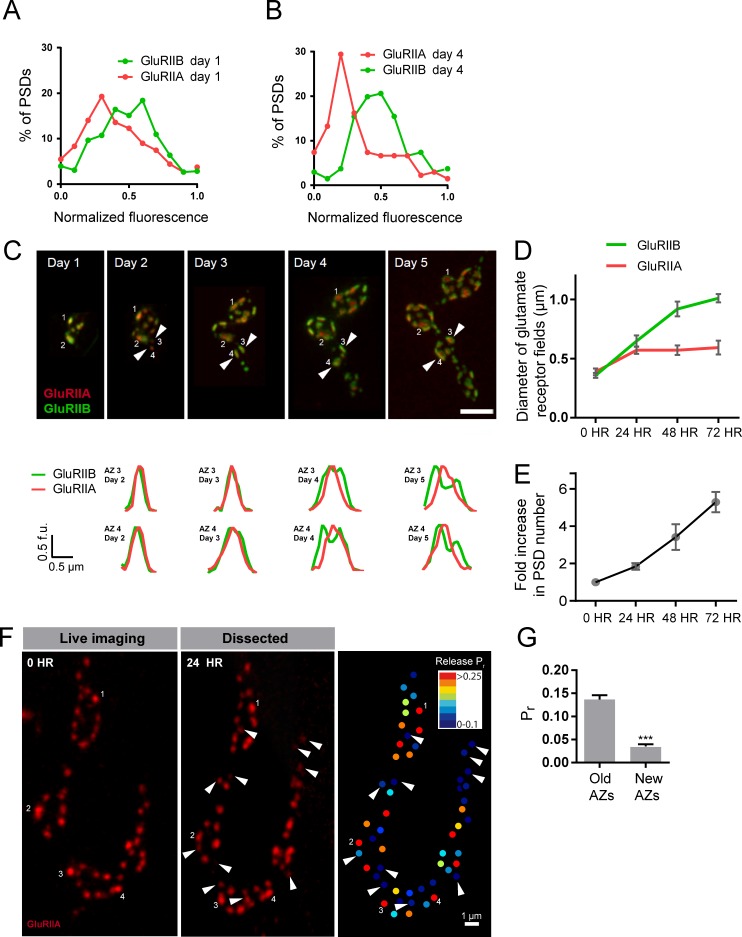
Figure 9. Rate of acquisition of glutamate receptor segregation during development.
Histograms of the distribution of normalized GluRIIA and GluRIIB fluorescence at the first instar (day 1) (A) and third instar (day 4) (B) stages for muscle 26 imaged through the cuticle of anesthetized larvae. For each data set, GluRIIA and GluRIIB fluorescence is presented from dimmest (0) to brightest (1). GluRIIA shows a more skewed distribution of fluorescence at day 4, consistent with its accumulation at high Pr AZs. (C) Representative muscle 26 NMJ image sequence showing appearance and maturation of two new synapses (#3 and 4) that were not present in the initial imaging session. Several preexisting synapses (#1 and 2) that developed the typical GluRIIB donut structure later in development are also labeled. The dashed box surrounds the actual imaged segment of the NMJ. New GluRIIA and GluRIIB clusters appear initially as small puncta (day 2, arrows) that become brighter on day 3. By day four they begin to display the donut like GluRIIB profile. At day 5, GluRIIB distribution to the periphery around a bright GluRIIA PSD representative of high Pr sites becomes prominent. The bottom panels show normalized GluRIIA and GluRIIB fluorescent line profiles for the newly identified PSDs (#3, 4) throughout the 5 day imaging series. (D) Diameter of glutamate receptor fields during the first 72 hr of PSD development. Error bars represent SEM. (E) Changes in AZ number during larval maturation at muscle 26 presented as a ratio of AZs observed during the first day of imaging (day 1). (F) Representative serial time points of GluRIIA-RFP in vivo imaging over 24 hr (left two panels). Newly formed PSDs are marked with white arrows; these displayed uniformly low Pr during release mapping (right panel). Several older PSDs with bright GluRIIA intensity are denoted with white numbers. (G) Average Pr of old AZs (those present in the 0 hr time point initial imaging session) and new AZs (AZs under 24 hr old that were first seen at the 24 hr time point). Student’s t-test was used for statistical analysis (***=p ≤ 0.001). Error bars represent SEM.


