FIGURE 1.

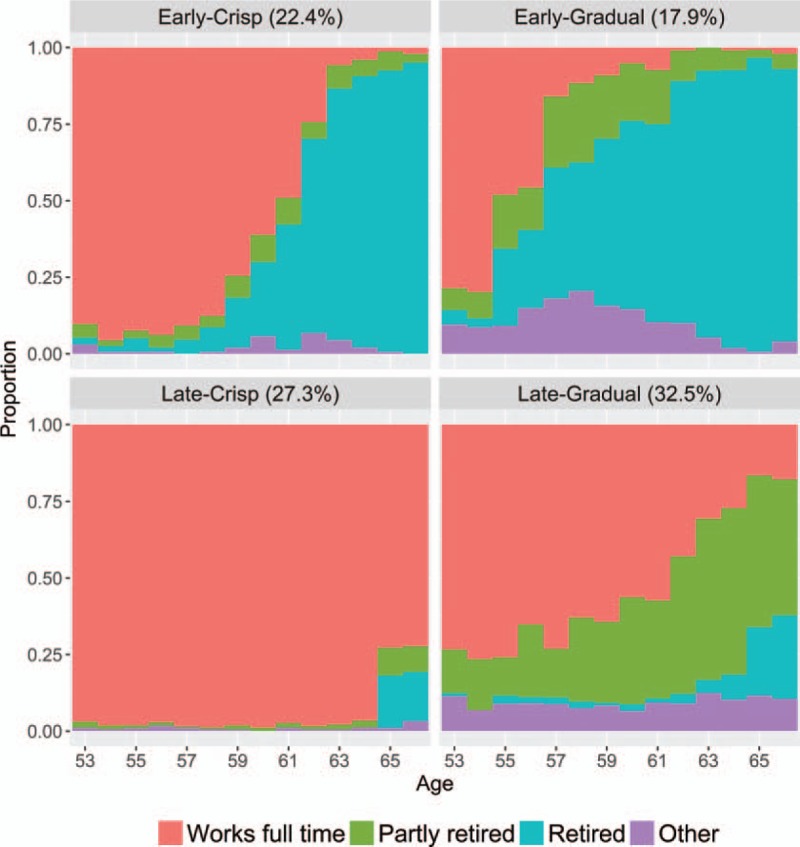
Cross-sectional overview of labor force status by year of age and retirement pathway (with proportion in sample). The areas give the proportion of respondents that correspond to each labor force status as shown in the legend.

Cross-sectional overview of labor force status by year of age and retirement pathway (with proportion in sample). The areas give the proportion of respondents that correspond to each labor force status as shown in the legend.