
. 2018 Jul 11;78(1):S3–S9. doi: 10.1097/QAI.0000000000001742
Copyright © 2018 The Author(s). Published by Wolters Kluwer Health, Inc.
This is an open access article distributed under the terms of the Creative Commons Attribution 3.0 IGO license (CC BY 3.0 IGO), which permits unrestricted use, distribution and reproduction in any medium, provided the original work is properly cited. The work cannot be changed in any way or used commercially without permission from the journal. http://creativecommons.org/licenses/by/3.0/igo/legalcode
FIGURE 2.
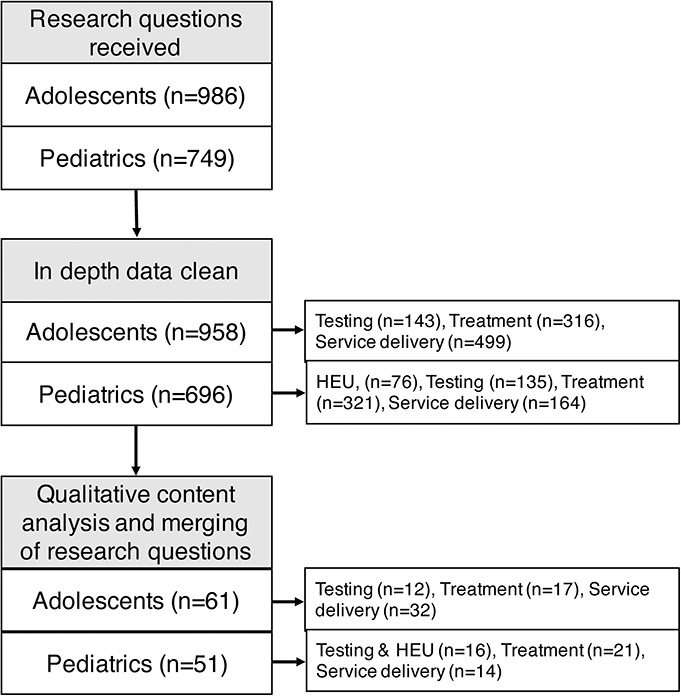
Flow diagram of data analysis process.HEU, HIV Exposed Uninfected.