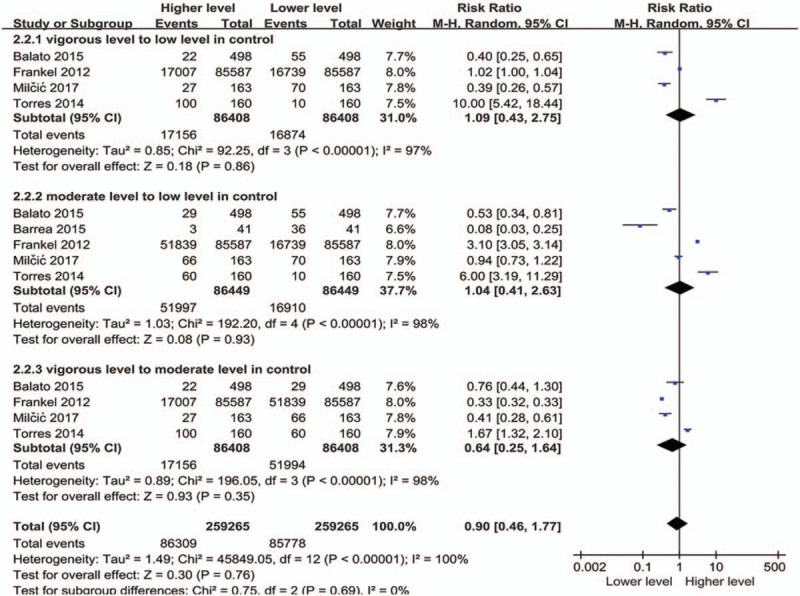
Figure 6.

Meta-analysis of healthy controls with different exercise levels. The point estimate (center of each blue square) and statistical size (proportional area of the square) are represented. Horizontal lines indicate 95% confidence intervals. The subtotal and total pooled RR (diamond) was calculated using a random-effects model. RR = risk ratio.
