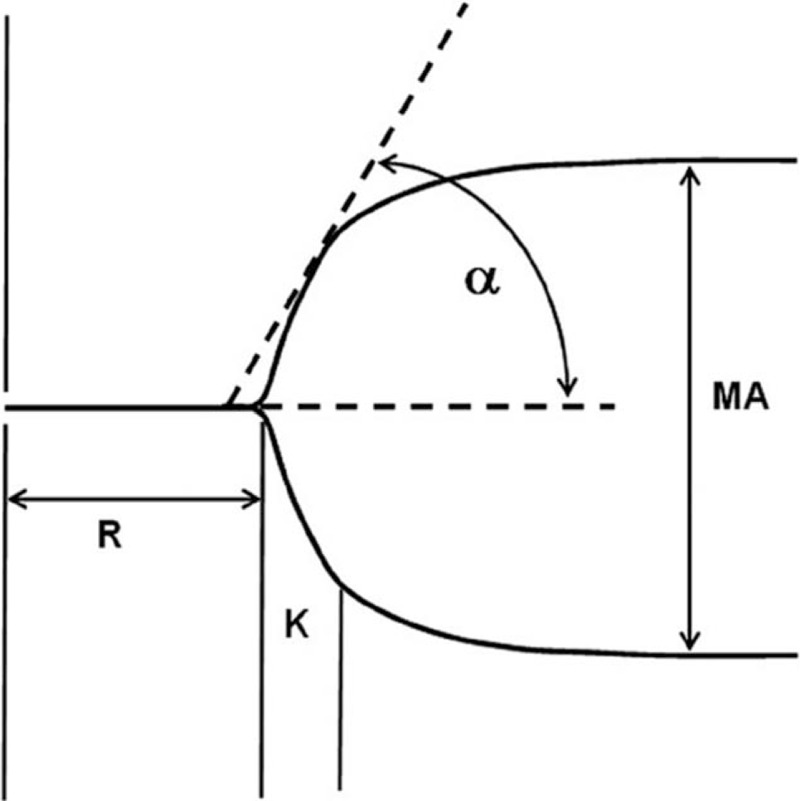
Figure 1.

Thrombelastograph tracing. α = the slope of the tracing from the R to K value, K = time from R to reach a 20 mm of amplitude, MA = maximum amplitude, R = time from 0 to 2 mm of amplitude. Normal range of R time, K time, α angle, and MA: 5–10 min, 1–3 min, 53°–72°, and 50–70 mm.
