
Figure 3.
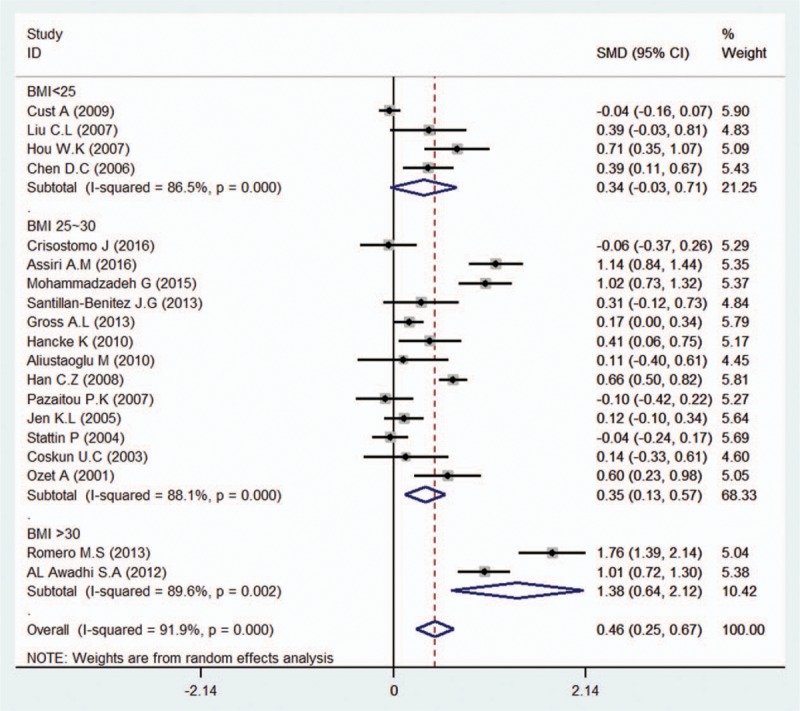
Subgroup analysis of the association between serum leptin levels and breast cancer in different BMI groups. Zero is not included in this confidence interval, which indicates a difference between the case and control groups. The negative SMD value suggests that the mean of the case groups is are lower than that of the control groups for the BMI below 25 group, while the positive SMD value suggests that the mean of serum leptin level in the case groups is higher than that in the control groups in both the BMI between 25 to 30 and the BMI exceeding 30 groups.