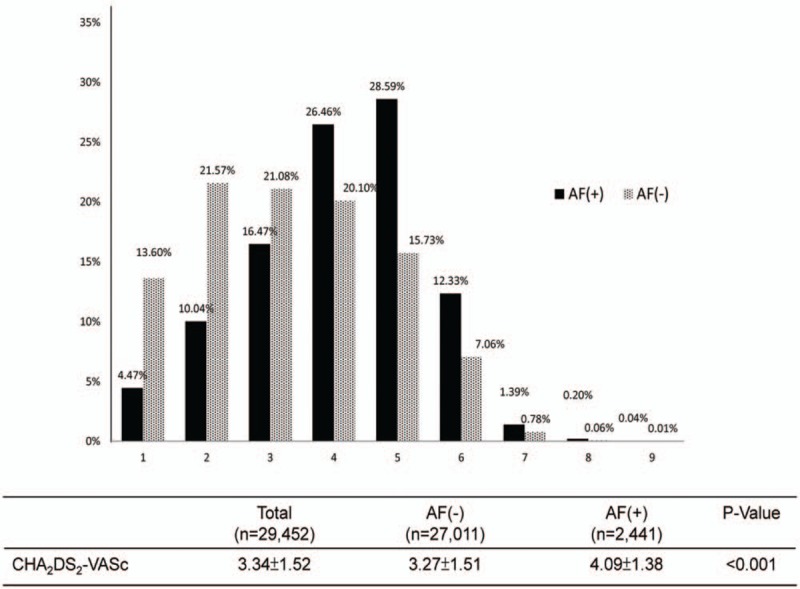
Figure 2.

Distribution of CHA2DS2-VASc scores. The bar chart compares the distribution of CHA2DS2-VASc scores between non-AF (gray) and new-onset AF (black) patients. The numbers above the bars denote the respective percentages. The figure shows the average CHA2DS2-VASc score and P value for each group. AF = atrial fibrillation.
