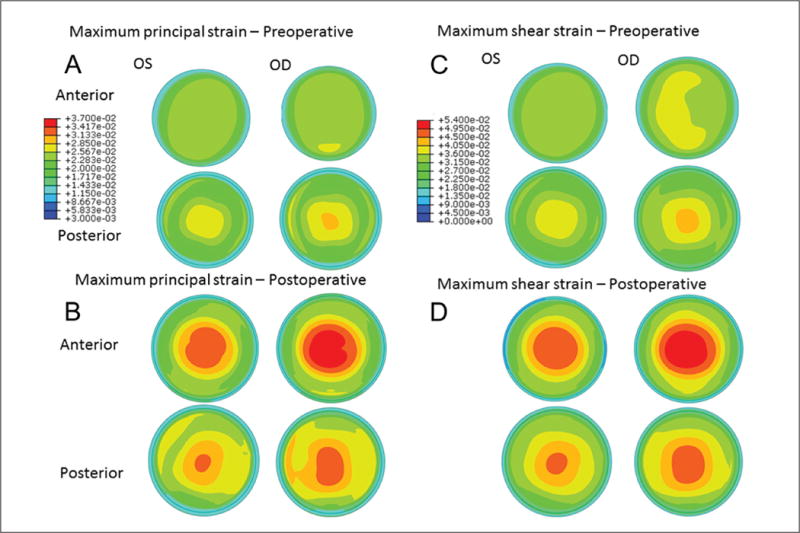
Figure 3.

Maps of maximum principal strain from the anterior and posterior stromal surfaces in the (A) preoperative and (B) simulated postoperative state. Higher strain values, larger areas of increased strain, and more eccentric distributions of strain are apparent in all states and in all regions in the eye that ultimately developed ectasia (right eye [OD]). An inferior region of locally concentrated strain was predicted in the postoperative state of the OD where the ectatic region manifested clinically (A). Highest focal maximum principal strain values (dimensionless units) from the anterior residual stromal bed were 0.038 in the left eye (OS) and 0.042 in the OD in the preoperative state, and 0.049 and 0.053, respectively, in the postoperative state. Maximum shear strain was also highly asymmetric in (C) preoperative and (D) postoperative models between eyes throughout the stroma and favored greater shear strain in the eye that eventually developed ectasia.
