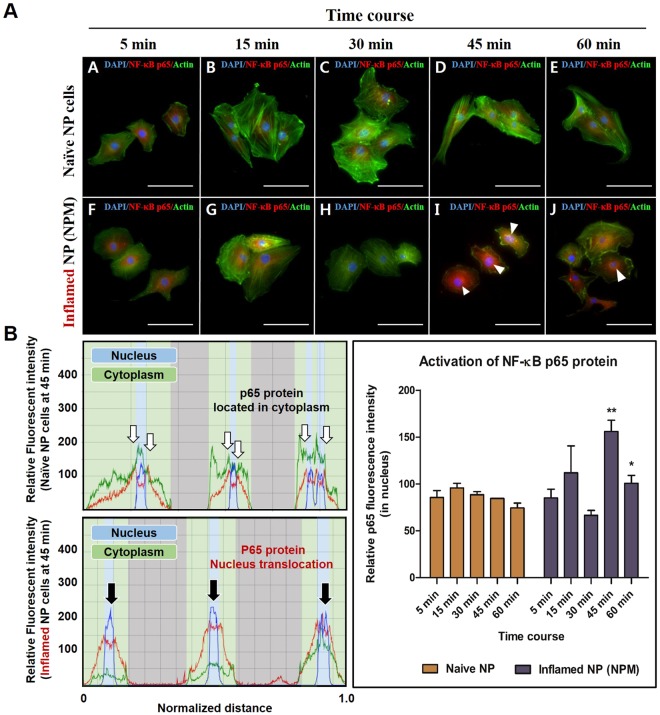
Figure 3.
Fluorescence images of preferential expression and translocation of NF-κB p65 protein, occurring in time-dependent manner. (A) Fluorescence image of NF-κB p65 protein levels in naïve and inflamed NP cells. (B) Quantification of the fluorescence intensity and preferential distribution of NF-κB p50 protein levels in naïve and inflamed NP cells. Human NP cells, exposed to MCM for 45 and 60 min, revealed translocation of p65 protein into the nucleus; this can trigger degenerative conditions because the p65 protein acts as a transcription factor. Scale bar = 100 μm.

