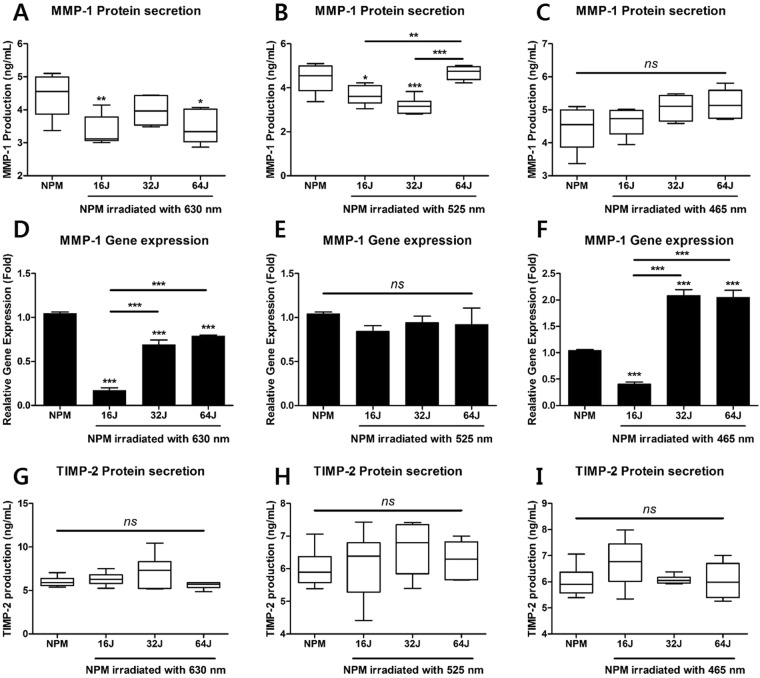
Figure 4.
Gene and protein expression of MMP-1, and production of TIMP-2 as endogenous inhibitor of MMP-1, in NPM treated with PBM. (A) Production of MMP-1 at 630 nm, (B) 525 nm, and (C) 465 nm. (D) The relative gene expression of MMP1 at 630 nm, (E) 525 nm, and (F) 465 nm. (G) Production of TIMP-2 at 630 nm, (H) 525 nm, and (I) 465 nm. Values are mean ± SE of three or four independent experiments. *p < 0.05, **p < 0.01, ***p < 0.001 as compared with NP, and line indicates comparison with each group. ns, no significant difference.

