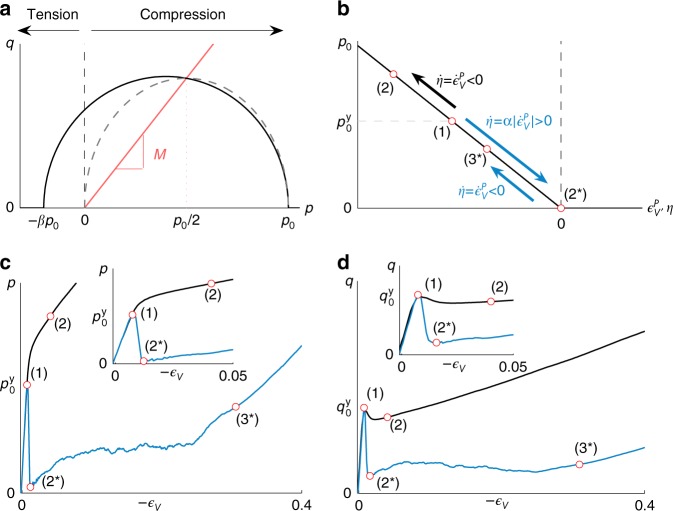
Fig. 1.
Overview of the elastoplastic model. a Cohesive (black line) and cohesionless (dashed gray line) cam clay yield surface in the p–q space. The red line corresponds to the Critical State Line. b Illustration of the hardening models (for the slab) and p0(η) (for the weak layer): the black arrow shows the classical hardening law used for the snow slab in which p0 increases in compression ; the blue arrows represent the new softening model for the weak layer for which p0 decreases under compression until after which the classical hardening law is used with β = 0. c Typical p– curve obtained for the unconfined compression of the weak layer in experiment number 2 (see Methods section for model parameters) for the classical hardening law (in black) and the new softening one (in blue). d Same as c but for the q– curve. In c and d, p and q in the weak layer (blue curves) do not perfectly reach zero after softening due to a loss of homogeneity (failure localization)

