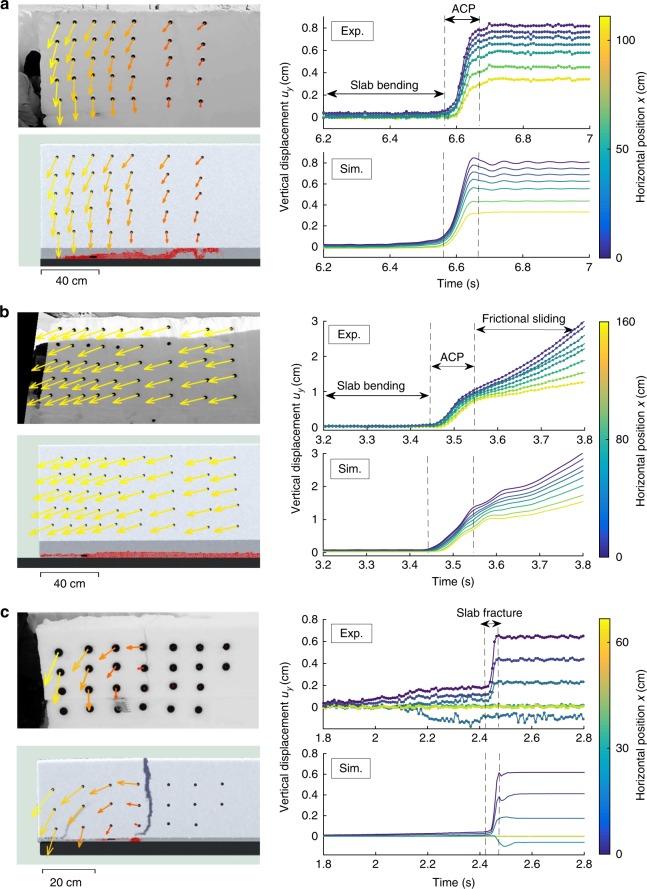
Fig. 2.
Comparison between experimental and simulated results. Experimental (top) and numerical (bottom) results for experiment number 1 (a), experiment number 2 (b), and experiment number 3 (c). The displacement field is shown on the left for different key instants in each case: during anticrack propagation (t = 6.65 s) in a; during frictional sliding (t = 3.7 s) in b, and after slab fracture (t = 2.5 s) in c. On the right, the time evolution of the average vertical displacement of vertical rows of markers is shown. The color represent the average horizontal position of each vertical row of markers. ACP anticrack propagation. The red color in the weak layer represents plasticity

