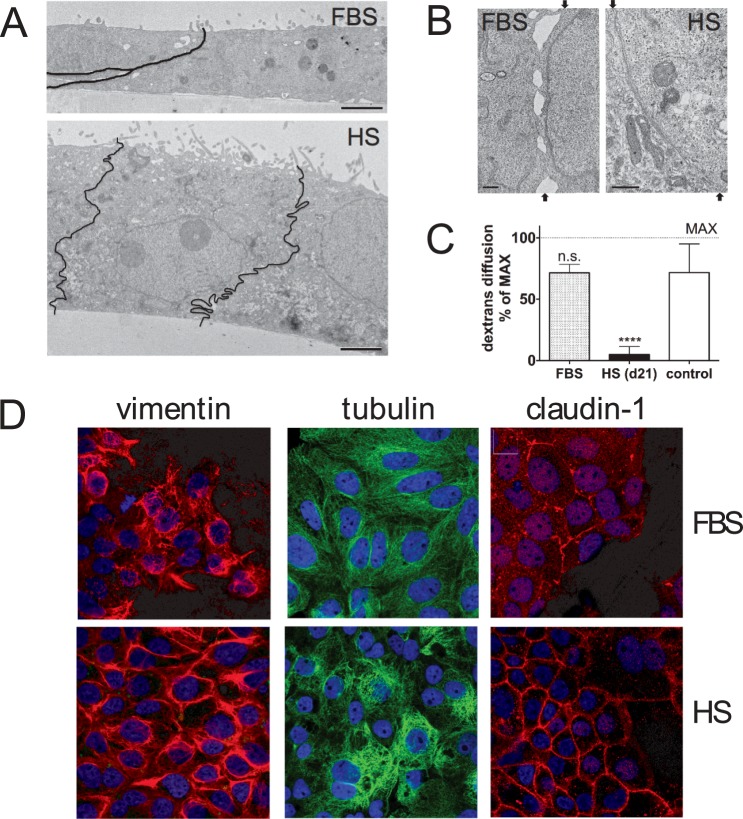
Figure 1.
Morphology of Huh7.5 cells cultured in FBS- and HS-containing media. (A) Electron micrographs of sagittal sections of Huh7.5 cells that were cultured in FBS-containing media (top image) and HS-containing media (bottom image). Black lines indicate the location of the borders between two HS cells. The images were taken at the same magnification (bar is 2 µm). Shown is a representative figure from 2 experiments with 2 transwell dishes each. (B) Electron micrographs of the border between two adjacent cell in FBS (left) and in HS (right). The arrows indicate the start and end of the border region on the image. Shown is a representative image of 3 experiments with 2 dishes each. (C) Dextran diffusion rate across confluent layers of FBS (FBS) and HS-cultured cells (HS d21), grown on transwell dishes. Subconfluent cultures were used as a control (control). Data are normalized to maximal diffusion rate (MAX), measured on dishes without cells. Data are presented as mean with standard deviation, from 4 independent experiments with two transwell dishes each. (D) Confocal imaging of FBS and HS-cultured Huh7.5 cells. Cytoskeleton components vimentin and tubulin where stained, as well as claudin-1, a tight junction component. Images are representative images taken from 3 separate coverslips.

