Figure 2.
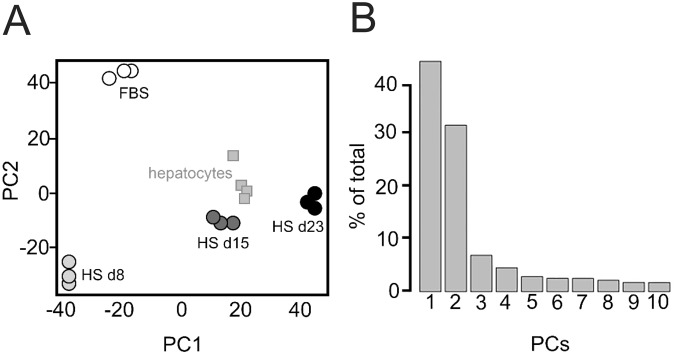
Principal component analysis. Principal component analysis (PCA) is a statistical method that is typically used as an exploratory method for data analysis, as it provides insight in the quality of a dataset, and in differences between experimental groups. (A) First two principal components (PCs) of triplicate genome-wide expression profiles of Huh7.5 cells in FBS and 8, 15, and 23 days after transfer to HS. To determine the similarity in gene expression between HS-cultured cells and primary hepatocytes, published hepatocyte expression profiles were projected onto the PCA, by applying the gene weights associated with PC1 and PC2 to the gene expression levels (squares). (B) Scree-plot indicating the total variance explained by the individual PCs. 75% of variance in gene expression is explained by the first two PCs principal components.

