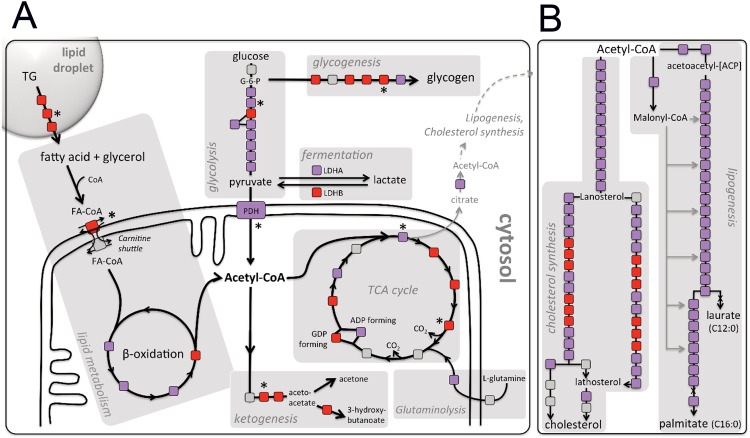
Figure 4.
Metabolic mapping. Analysis of several metabolic pathways using HumanCyc: Encyclopedia of human genes and metabolism. Each enzyme in a biosynthetic pathway is depicted as a square. Changes in transcription levels are color-coded: red indicates an activated gene (P < 0.05), purple indicates a deactivated gene (P < 0.05) and grey indicates no significant change. Asterisks indicate the (predicted) rate limiting or rate regulating steps of the metabolic pathway. (A) Activity of the main ATP producing pathways in cells (B) cholesterol synthesis and lipogenesis.

