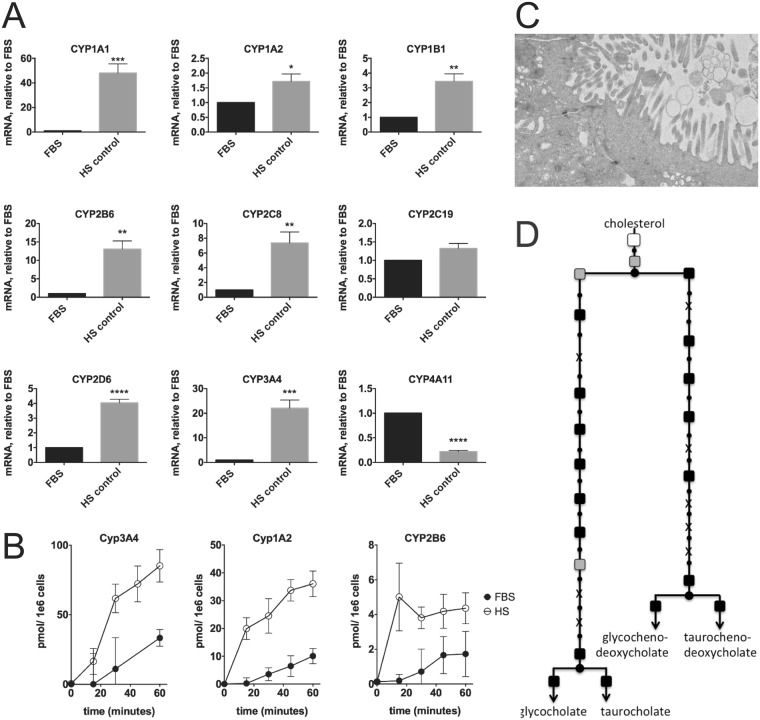
Figure 6.
Cytochrome P450 metabolism and bile production. (A) mRNA of different cytochrome P450 (CYP) genes, as determined by quantitative PCR. Data are depicted as mean ± s.d. n = 4 (4 biological replicates with duplicate measurements each). Statistical significance was calculated using Student’s t-test. P values ranges are depicted as asterisks: *P < 0.05, **P < 0.01, ***P < 0.001, ****P ≤ 0.0001, n.s: P > 0.05 (B) Activity of selected CYPs, measured with a substrate cocktail assay. Shown is a representative time-series, of 3 independent experiments with duplicate cell culture dishes each. (C) Electron micrograph of a structure resembling a bile canalicular surface. Bar represents 500 nm. Shown is a representative figure from 2 experiments with 2 transwell dishes each. (D) Metabolic mapping of microarray data, of enzymes involved in bile acid synthesis. See the legend of Fig. 5A for further description of this analysis.

